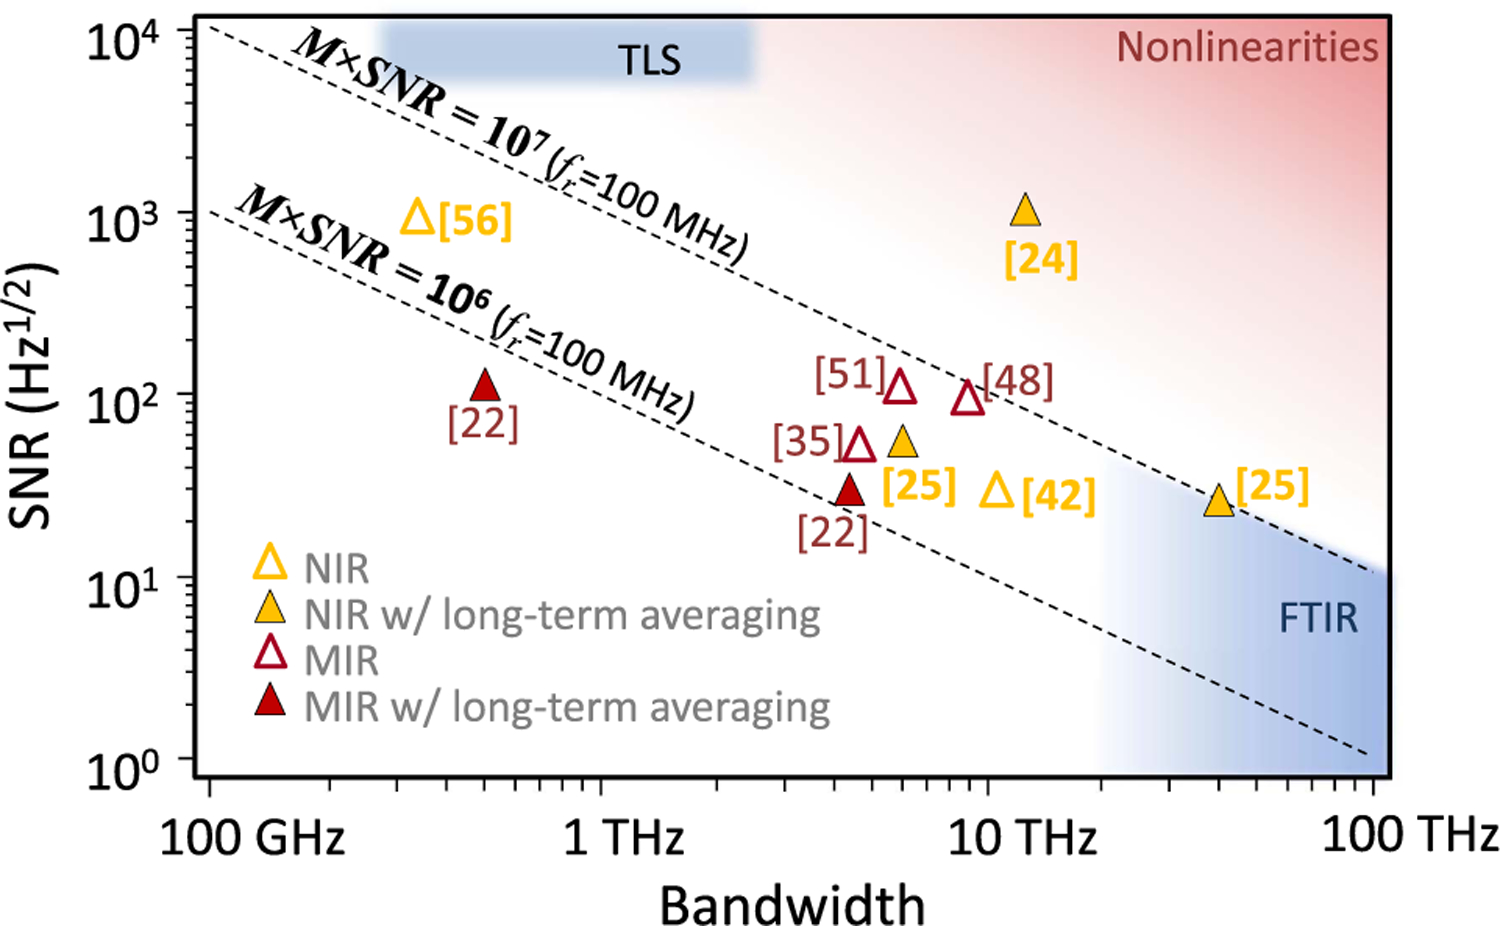
Fig. 6.

Spectral SNR versus bandwidth for DCS demonstrations in the near-IR (NIR; yellow triangles) and mid-IR (MIR; red triangles). In the near-IR, data points include only experiments that enforced mutual coherence through either active phase/timing feedback [25], digital phase/timing correction [24], or analog adaptive sampling [42]. The solid triangles indicate that coherent averaging was implemented. Approximate regions of operation for FTIR and tunable laser spectroscopy (TLS) are added in blue. The number of spectral elements M is the bandwidth/fr, where fr is ∼100 MHz for most demonstrations shown here.
