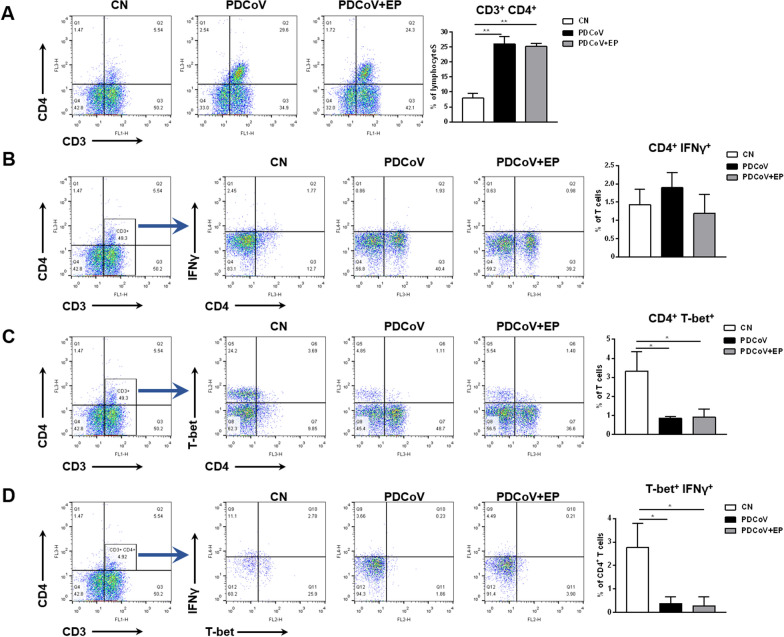
Figure 5.
Effect of PDCoV infection on T-lymphocyte subpopulations in the peripheral blood. Peripheral blood samples of the indicated groups were collected at 5 dpi. Left, representative flow cytometry dot plots show the percentage of CD4+ T cells within the peripheral blood lymphocytes (A), the percentage of CD4+ IFNγ+ T cells (B) and CD4+ T-bet+ T cells (C) within the peripheral blood T cells, and the percentage of CD4+ T-bet+ IFNγ+ T cells within the peripheral blood CD4+ T cells (D) in the indicated piglets. Right, flow cytometry analysis of the percentage of CD4+ T cells within the peripheral blood lymphocytes (A), the percentage of CD4+ IFNγ+ T cells (B) and CD4+ T-bet+ T cells (C) within the peripheral blood T cells, and the percentage of CD4+ T-bet+ IFNγ+ T cells within the peripheral blood CD4+ T cells (D) in the indicated piglets. Data are presented as the mean ± SEM. *P < 0.05; **P < 0.01.

