Figure 10.

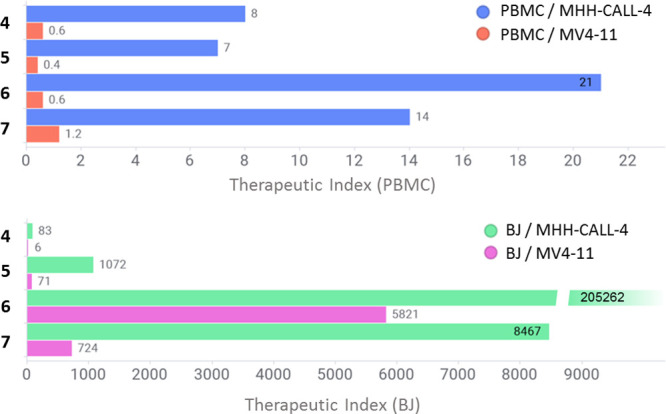
In vitro therapeutic index of compounds 4–7: the bars represent the ratio of EC50 values in noncancerous and leukemia cells: PBMC and MHH-CALL-4 (blue), PBMC and MV4-11 (red), BJ and MHH-CALL-4 (green), and BJ and MV4-11 (magenta).

In vitro therapeutic index of compounds 4–7: the bars represent the ratio of EC50 values in noncancerous and leukemia cells: PBMC and MHH-CALL-4 (blue), PBMC and MV4-11 (red), BJ and MHH-CALL-4 (green), and BJ and MV4-11 (magenta).