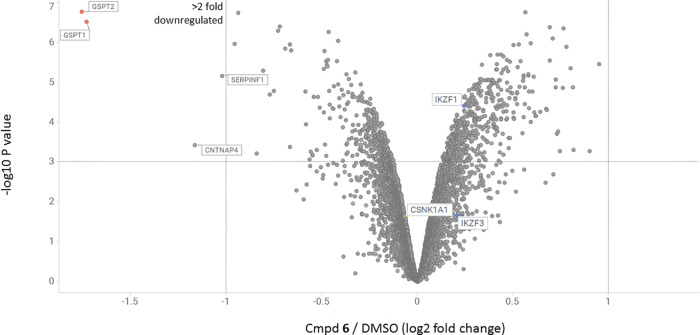
Figure 9.
Quantitative TMT-proteomics in MV4-11 cells after 4 h of treatment with compound 6 at 1 μM concentration. Dataset represents average of n = 4 replicates. Proteins downregulated more than 2-fold (dotted line on Log2 = −1 on X-axis) with the p-value less than 0.001 (dotted line on −Log10P value = 3 on Y-axis) are shown in the upper left region of the plot.

