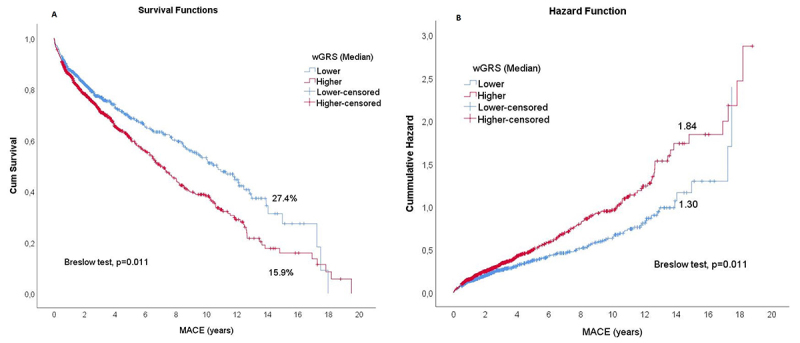
Figure 4 ‒ Survival analysis for patients with and without MACE, comparing wGRS above and below the median. (A) Cumulative survival curves: Lower- and higher-censored data are the individuals who, at the time of follow-up, didn’t develop any type of MACE in each wGRS categories (Lower and higher than median). (B) Cumulative hazard curves: Lower- and higher-censored data are the individuals who, at the time of follow-up, didn’t develop any type of MACE in each wGRS categories (Lower and higher than median).

