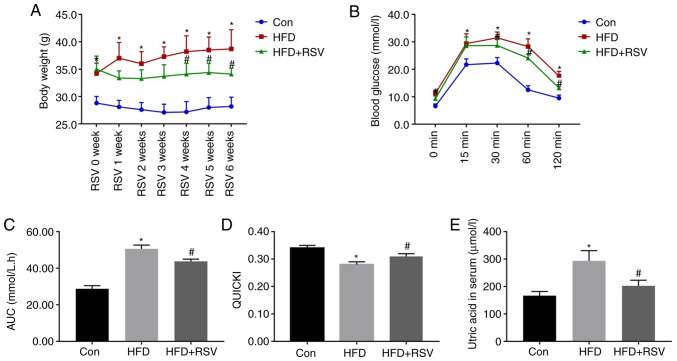
Figure 2.
Body mass, serum uric acid concentration, glucose tolerance and insulin sensitivity after RSV administration. (A) Body mass of Con, HFD-fed and HFD + RSV-administered groups. (B) Blood glucose concentrations 0, 15, 30, 60 and 120 min after the intraperitoneal injection of glucose. (C) Area under the glucose curve. (D) Quantitative insulin sensitivity check index. (E) Serum uric acid concentrations in the Con, HFD and HFD + RSV groups. Data are presented as the mean ± SD (n=10). One-way ANOVA, followed by Bonferroni's post hoc, or Tamhane's multiple comparison post hoc tests, was used for statistical analysis. *P<0.05 vs. Con group; #P<0.05 vs. HFD group. AUC, area under the curve; Con, control; HFD, high-fat diet; RSV, resveratrol.

