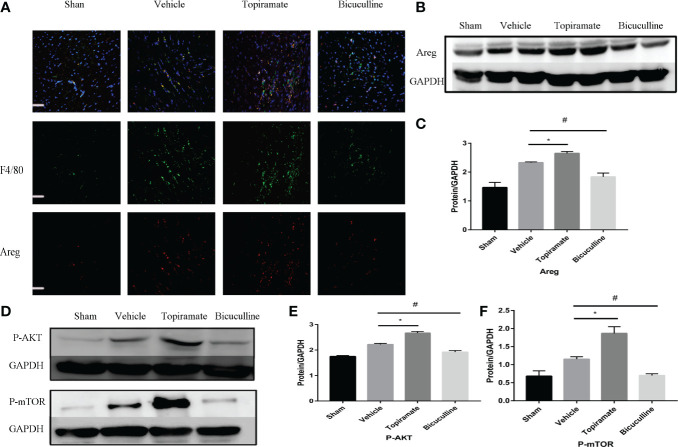
Figure 5.
Areg expression and Akt/mTOR signaling are involved in the GABAA receptor-mediated cardiac hypertrophy. (A) Representative micrographs showing immunofluorescent staining of Areg (red) and a macrophage marker, F4/80 (green) in a sample of heart tissue. Nuclei were counterstained with DAPI (blue). Scale bar = 50 µm. (B) Representative images of Areg protein at day 7 post-TAC in heart. (D) Representative images of P-Akt and P-mTOR protein at day 7 post-TAC in heart. (C, E, F) Quantitative analysis of Areg protein (C), P-Akt protein (E), and P-mTOR protein (F) at day 7 post-TAC in heart. GAPDH mAb (middle) was used as a loading control. Data are mean ± SEM, by one-way ANOVA with Bonferroni’s multiple comparison test. For topiramate treatment, *P < 0.05 vs. vehicle. For bicuculline treatment, #P < 0.05 vs. vehicle. (each group, n = 6).

