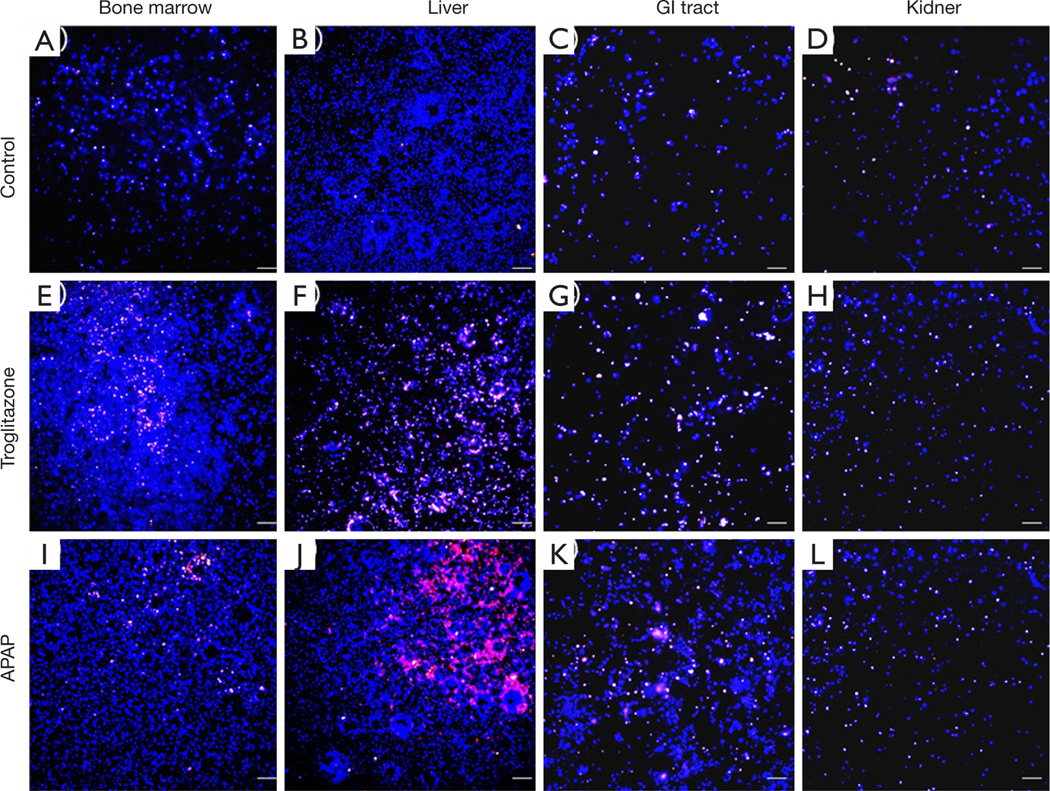
Figure 3.
Fluorescence microscopy images of cells co-cultured in the body cube for 72 h. Control cultures without drug: (A) bone marrow, (B) liver, (C) GI tract, (D) kidney. Co-cultures exposed to troglitazone: (E) bone marrow, (F) liver, (G) GI tract, (H) kidney. Co-cultures exposed to acetaminophen (APAP): (I) bone marrow, (J) liver, (K) GI tract, (L) kidney. The cells were stained with viability dye. Blue cells are live cells and pink cells are no longer viable. Scale bars represent 100 μm.

