
FIGURE 2.
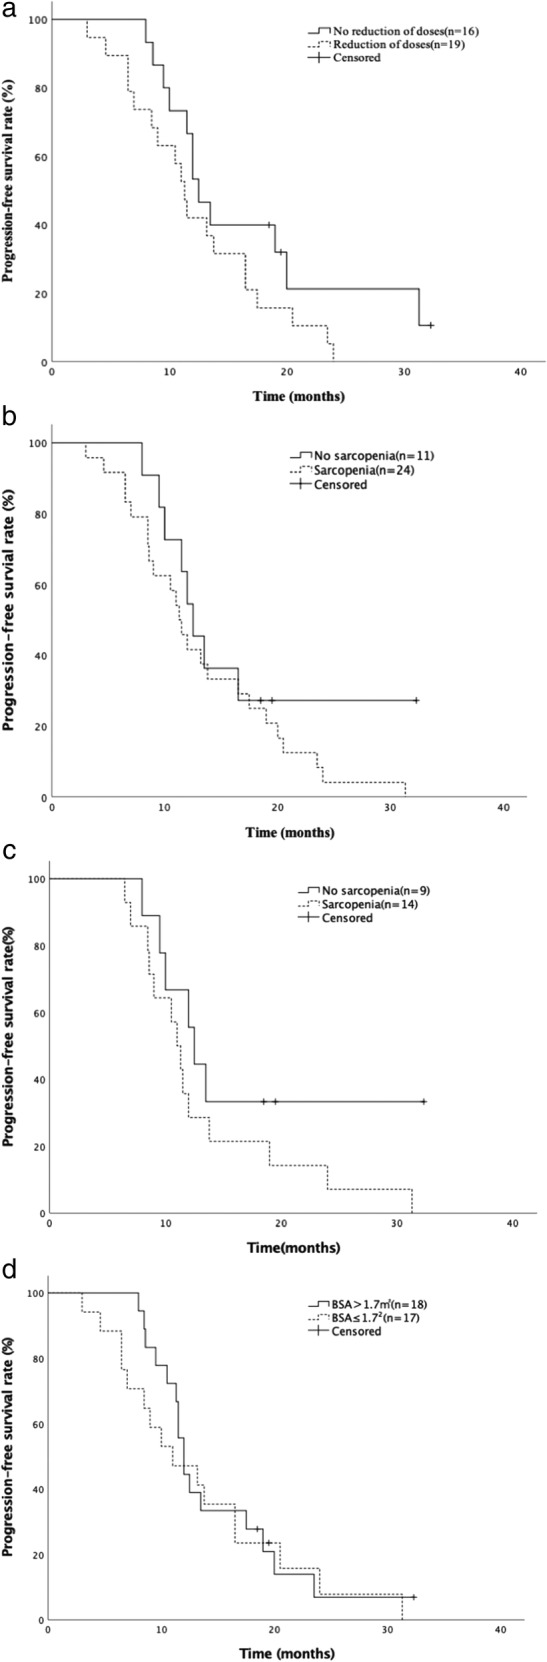
Kaplan–Meier survival curves for progression‐free survival (PFS). (a) PFS comparison between patients with and without dose reduction of afatinib. (b) PFS comparison between patients with and without sarcopenia. (c) PFS comparison between patients with and without sarcopenia among patients with EGFR common mutations. (d) PFS comparison between patients with BSA>1.7 m2 and ≤ 1.7 m2. EGFR, epidermal growth factor receptor; BSA, body surface area