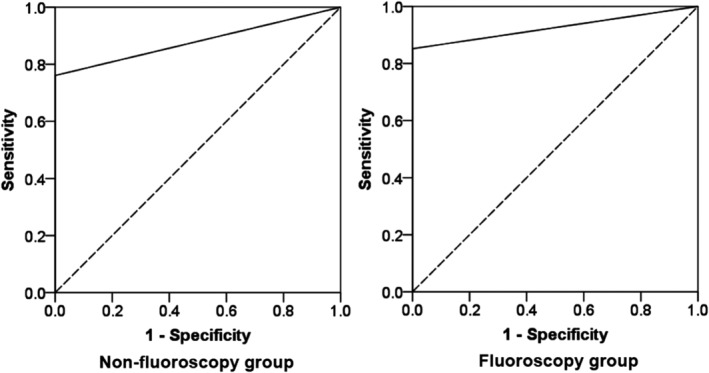
FIGURE 3.

The receiver operating characteristic curve (ROC) of the diagnostic yield for malignancy in the two groups. The area under the curve was 0.88 (p = 1.85E‐05) and 0.93 (p = 6.73E‐04) for the nonfluoroscopy and fluoroscopy groups, respectively
