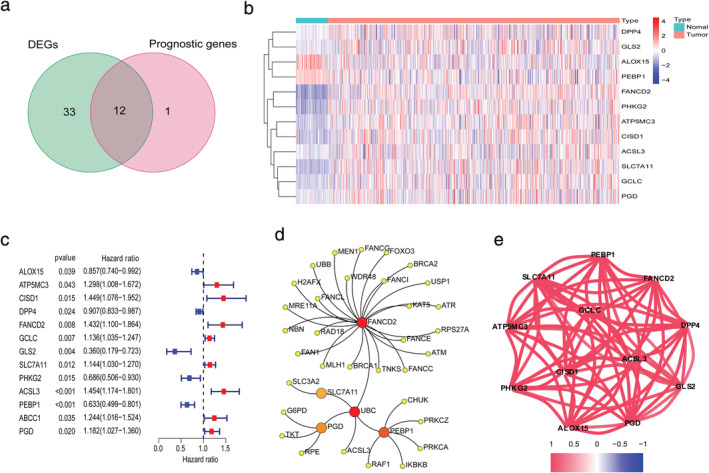
FIGURE 2.

Identification of the candidate ferroptosis‐related genes in The Cancer Genome Atlas (TCGA) cohort. (a) Venn diagram which identified differentially expressed genes between tumor and adjacent normal tissue that were correlated with overall survival (OS). (b) The expression of 12 ferroptosis‐related genes (FRGs) in lung adenocarcinoma (LUAD) patient samples is shown. The upregulated FRGs are indicated in red and downregulated FRGs in blue. (c) Univariate Cox regression analysis results show the association between gene expression and OS. (d) The PPI network downloaded from the STRING database indicated the interactions among the candidate genes. (e) The correlation network of candidate genes. The correlation coefficients are represented by different colors
