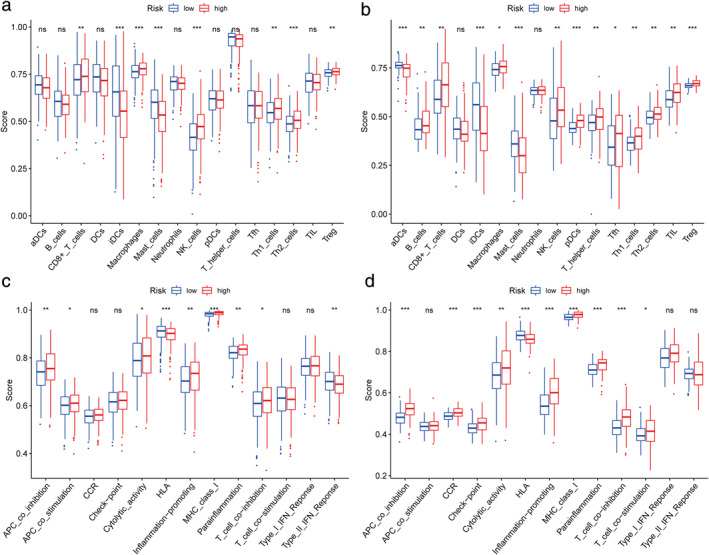
FIGURE 7.

Comparison of the ssGSEA scores between different risk groups in the TCGA cohort (a,c) and GEO cohort (b,d). The scores of 16 immune cells (a,b) and 13 immune‐related functions (c,d) are shown in boxplots. p‐values are shown as: Ns, not significant; *p < 0.05; **p < 0.01; ***p < 0.001
