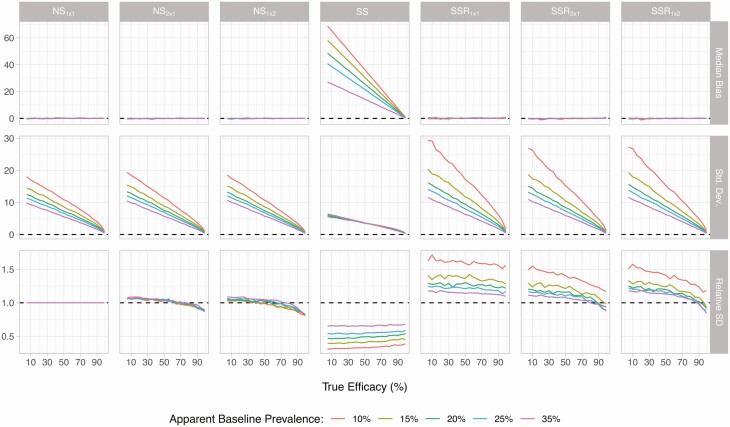
Figure 2.
Bias and precision of estimated drug efficacy as a function of true drug efficacy and baseline prevalence by sampling design. Lines represent the median bias in egg reduction rate (ERR) estimates (top row), the standard deviation (SD) of ERR estimates (middle row), and the relative SD of estimates relative to the SD based on the NS1 × 1 design. Results are based on 5000 repeated simulations, assuming a total budget equivalent to the cost of collecting and testing 1200 single Kato-Katz thick smears (KK). The “no screening” and “screen, select, and retest” designs each have 3 variants in which testing at follow-up is based on either a single KK (subscript 1 × 1), 2 slides based on 2 different fecal samples (2 × 1), or 2 KK based on the same stool sample (1 × 2). In the “screen and select” design, follow-up testing is based on a single KK. Abbreviations: NS, no screening; SD, standard deviation; SS, screen and select; SSR, screen, select, and retest.

