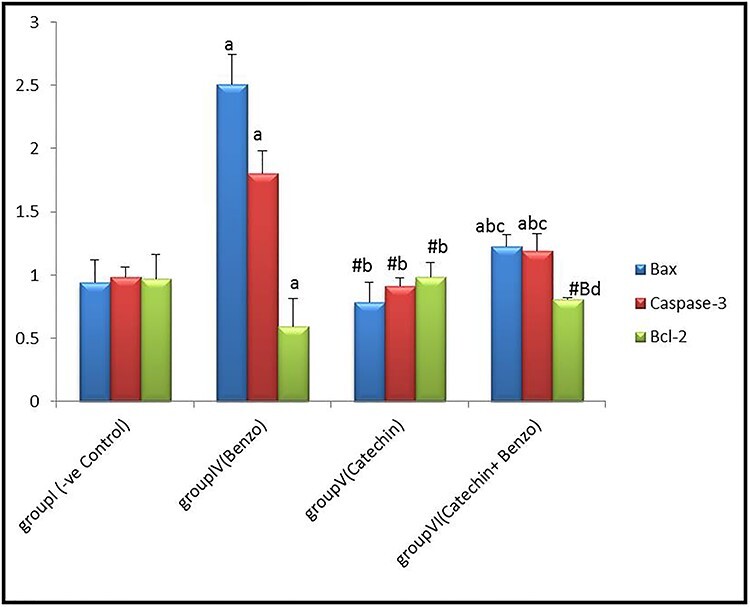
Figure 5.

Bar chart showing comparative magnitude of the mean values of Bax, caspase-3 and Bcl-2 in group I (−ve control), group IV (benzo[a]pyrene), group V (catechin), and group VI (catechin and benzo[a]pyrene) in renal tissue after four weeks of administration. #P > 0.05, *P < 0.05, aP < 0.01 compared to group I, bP < 0.01, BP < 0.05 compared to group IV, cP < 0.01, dP > 0.05 compared to group V.
