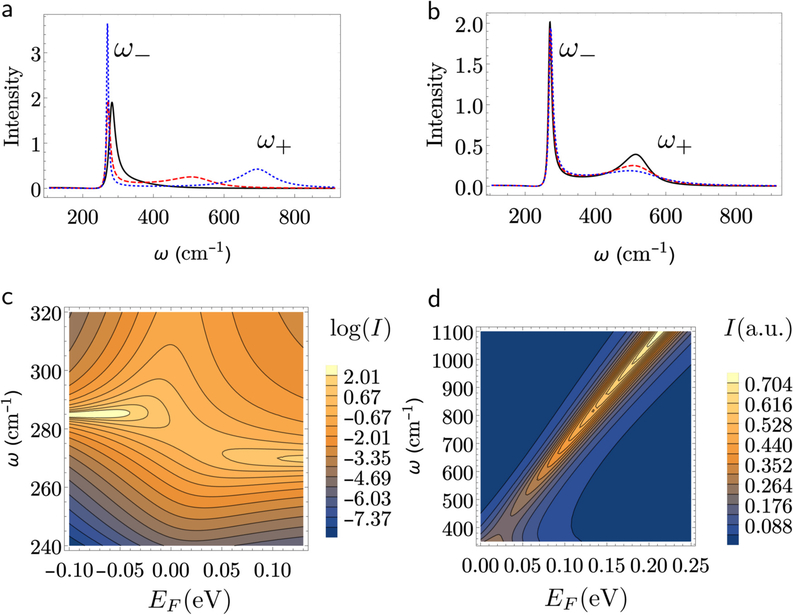
FIG. 2.
Raman scattering line shapes obtained from Eq. (8) for model systems. (a) Line shape as a function of the incident frequency ω for three different values of the Fermi energy EF at a fix damping rate of γ = 7 meV, EF = 0 eV (black, solid), EF = 0:05 eV (red, dashed), and EF = 0:10 eV (blue, dotted). (b) line shape for different values in the damping energy γ at a fix value Fermi energy EF = 0:05 eV, γ = 3:5 meV (black, solid), γ = 7 meV (red, dashed), and γ = 10:5 meV (blue, dotted). (c) and (d) present, respectively, in the logarithmic and normal scale, contour plots for the Raman Spectra I, in atomic units, as a function of the Raman frequency ω and the Fermi energy EF. (c) Reveals the formation of hybrid plasmon–phonon states with characteristic frequencies ω− and ω+. Due to thermal broadening and the plasmon damping, the avoided crossing in the dispersion curve is shadowed. (d) shows how the frequency ω+ shifts with Fermi energy EF. Although the intensity of the ω+ branch increases with EF, in real Raman scattering measurements the intensity of this branch decreases as the electron density increases due to the increase of plasmon damping arising from ionized impurity scattering. Other parameters are CFH = −0:28, ωLO = 284.7 cm−1, ωTO = 267:8 cm−1, meff = 0:067mo, ε∞ = 10.9.

