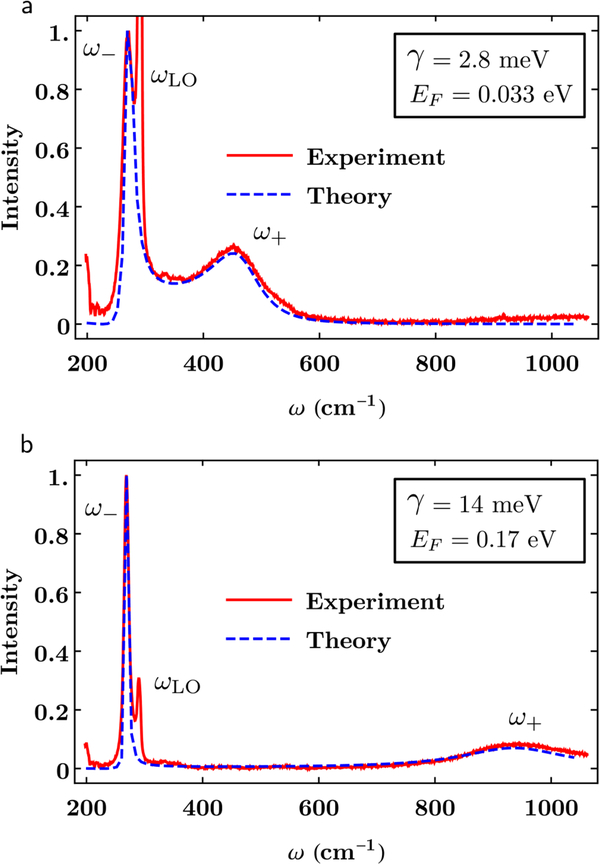
FIG. 3.
Numerical fit of the theoretical line shape in Eq. (8) to the experimentally measured Raman spectra reported in Fig. 1. The intensity is normalized to the maximum of the ω− peak. The Fermi energy EF and the damping γ are the fitting parameters. In (a) EF = 33 meV and γ = 2.8 meV and (b) EF = 0.17 eV and γ = 14 meV. Other parameters are as in Fig. 1.

