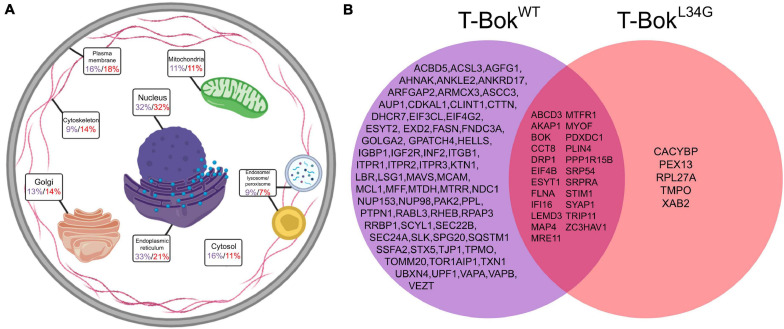
FIGURE 2.
TurboID-BokWT and TurboID-BokL34G interactomes. (A) Localization of proteins identified by T-BokWT (purple) and T-BokL34G (red). Percentage values are the percent of proteins assigned to the specified subcellular compartment; as proteins were assigned to 1–3 compartments, percentages add to >100%. For further information, see Supplementary Tables 1, 2. (B) Comparison of proteins identified by T-BokWT and T-BokL34G. The proteins shown were present in at least 6/7 and 4/5 independent experiments, respectively.

