
Fig. 4 |. Temperature dependence of SCFP in uTe2.
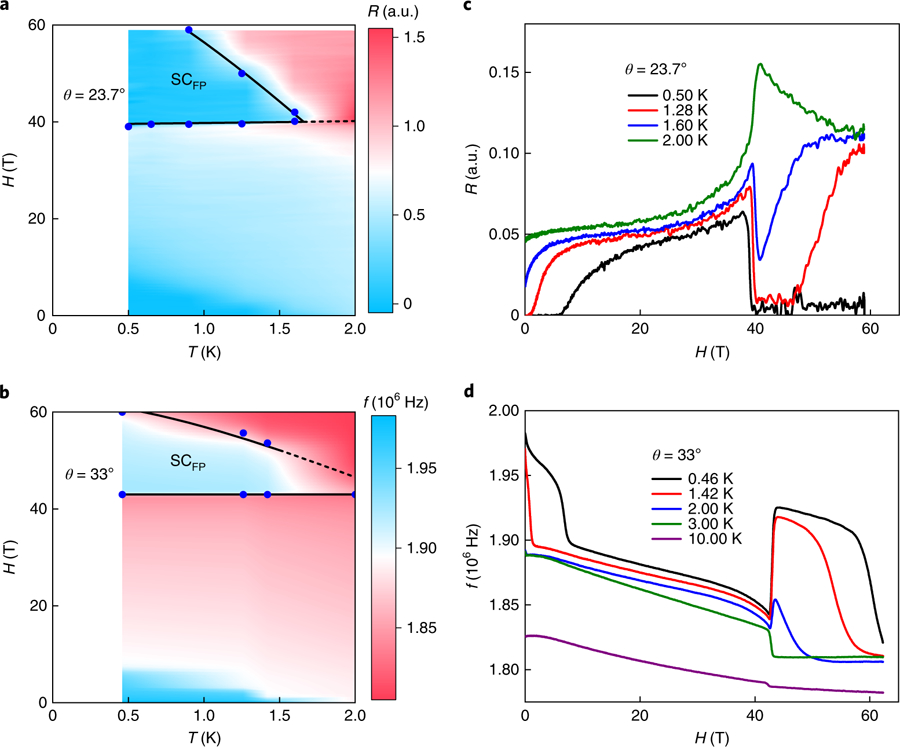
a,b, Colour contour plots of R (a) and f (b) of PDO measurements as a function of T and H at θ = 23.7° (a) and θ = 33° (b). The blue dots are the critical fields for SCFP and the dashed lines are guides to the eye, extrapolated to the region where there are no data. c,d, The corresponding data as a function of the applied magnetic fields at selected temperatures.