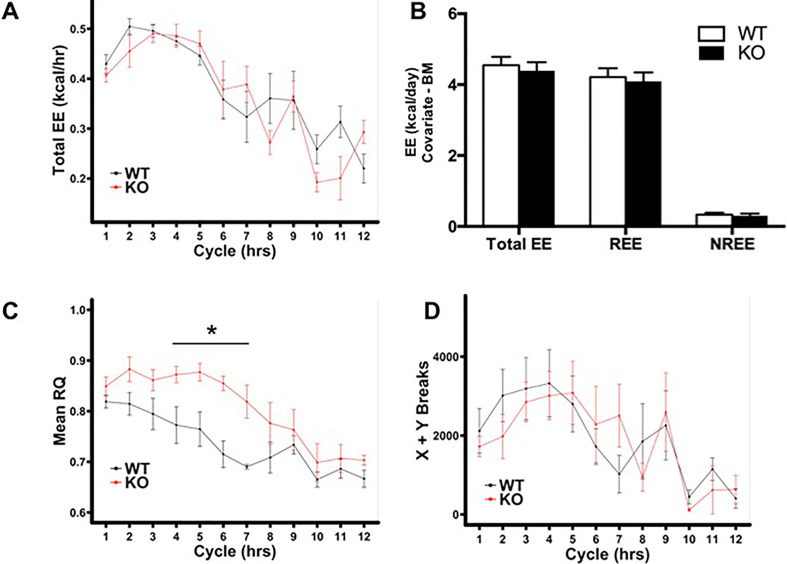
Figure 3.
HNF4α-KO mice exhibit elevated RQ during fasting. (A) Mean hourly total EE during 12-h fast. Raw values have not been adjusted for BM differences. (B) Total EE, REE, and NREE during 12-h fast. Means adjusted with BM used as a covariate for EE. (C) Mean hourly RQ during 12-h fast. (D) Activity during 12-h fast expressed as total X and Y beam breaks per hour. Values are means ± SEM. Statistical significance determined by one-way ANOVA. *p < 0.05 between WT and HNF4α-KO.

