
Fig. 1.
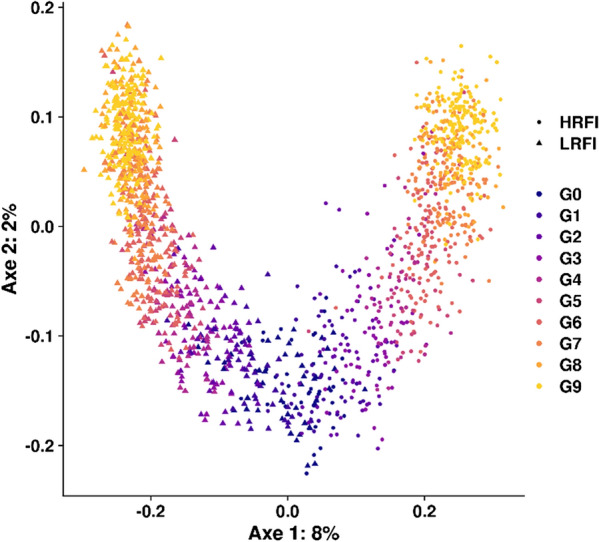
The first two axes of the multidimensional scaling (MDS) analysis, based on the 570,447 genotypes. Points represent individuals (corresponding to all sires and dams of the population, N = 1632) and colors are generations
Official websites use .gov
A
.gov website belongs to an official
government organization in the United States.
Secure .gov websites use HTTPS
A lock (
) or https:// means you've safely
connected to the .gov website. Share sensitive
information only on official, secure websites.
The first two axes of the multidimensional scaling (MDS) analysis, based on the 570,447 genotypes. Points represent individuals (corresponding to all sires and dams of the population, N = 1632) and colors are generations