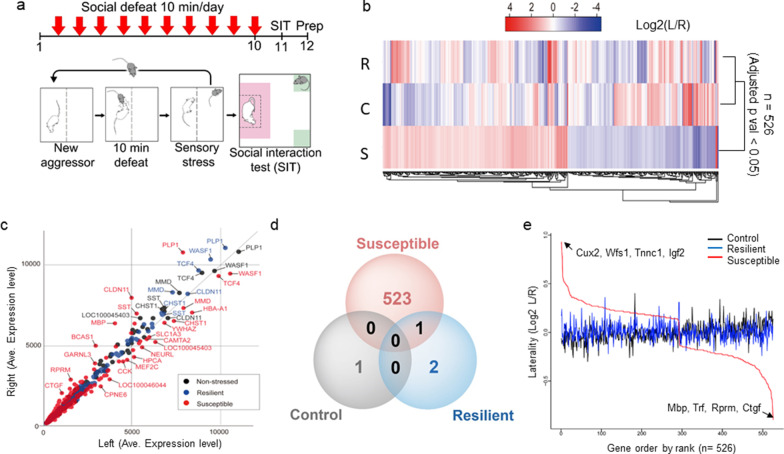
Fig. 1.
Experimental scheme for social defeat stress and differences in stress-induced gene expression profiles between the mPFC cortices. a Timeline of the utilized social defeat stress paradigm; mPFC tissue was prepared as indicated 1 day after the social interaction test. b Log2 L/R values are graphically presented in heatmap format, where an intense red color indicates that the gene is highly expressed in the left (L) mPFC and an intense blue color indicates that the gene is highly expressed in the right (R) mPFC. Genes with an FDR (false discovery rate) adjusted p-value less than 0.05 are rearranged according to the log2 L/R ratio. Genes with a p-value > 0.05 were not included in the analysis. S = Susceptible, R = Resilient, C = Control. c Averaged gene expression levels from microarray experiments, with left mPFC values plotted on the x-axis and right mPFC values plotted on the y-axis. The distribution of genes expressed in susceptible mice (red dots) is compared with that of genes from resilient mice (blue dots) and non-stressed control mice (black dots). d Venn diagram showing the number of genes exhibiting significant laterality in the various mouse groups. Red circle, 524 genes exhibited laterality in susceptible mice (one gene in common with resilient mice); blue circle, three genes exhibited laterality in resilient mice (one gene in common with susceptible mice); black circle, one gene exhibited laterality in non-stressed control mice. The total list is presented in Additional file 4: Table S2. e The x-axis indicates genes ordered by rank and the y-axis indicates genes ordered by laterality value (log2 L/R). Positive laterality indicates genes that are highly expressed in the left mPFC relative to the right mPFC, whereas negative laterality denotes genes that are highly expressed in the right mPFC. Cux2, Wfs1, Tnnc1, and Igf2 are left-mPFC lateralized, while Ctgf, Rprm, Trf, and Mbp are right-mPFC oriented genes

