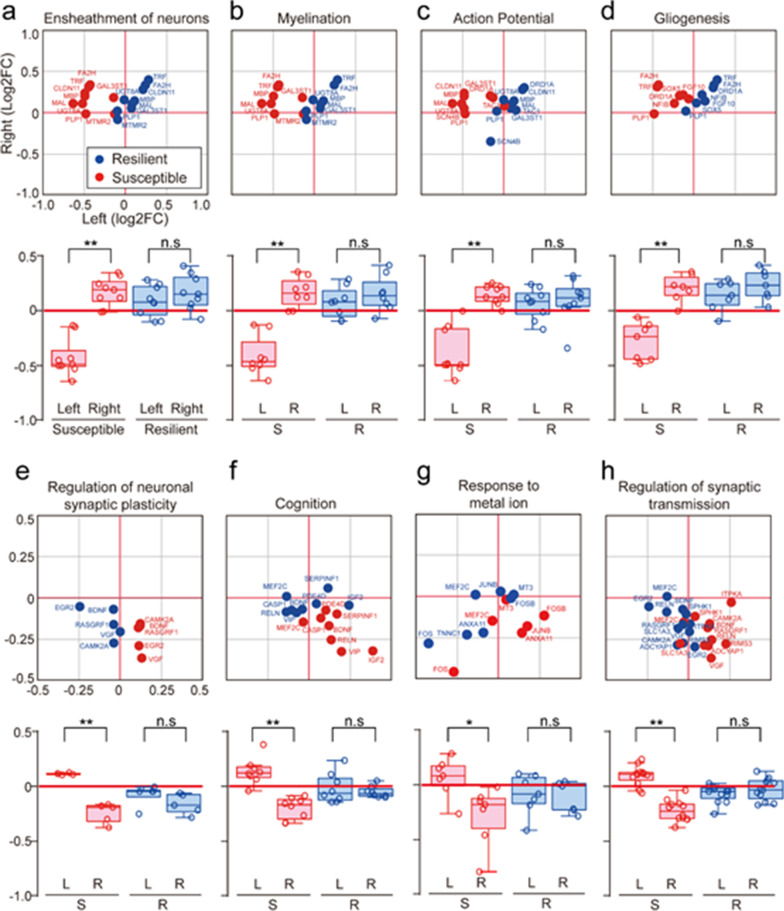
Fig. 2.
Functional annotation of genes that show lateralization in susceptible mice. GO analysis of genes exhibiting laterality. The GeneMANIA program with the Cytoscape plugin was used for GO analysis. a Upper panel: The genes Cldn11, Fa2h, Gal3st1, Mal, Mbp, Mtmr2, Plp1, Trf, and Ugt8a were associated with the GO term, ensheathment of neurons, and were dominantly expressed in the right mPFC hemisphere of susceptible mice. Fold changes (FC) in gene expression relative to controls, expressed as log2 FC values, are shown in a dot plot, where the x-axis represents values for the left mPFC and the y-axis represents values for the right mPFC. Blue, resilient values; red, susceptible values. Lower panel: Results are presented in box plot format (**p = 0.000000330 for susceptible left vs. susceptible right, t16 = -8.324, t-test, n = 9). b Upper panel: The genes Fa2h, Gal3st1, Mal, Mbp, Mtmr2, Plp1, Trf and Ugt8a were associated with the GO term, myelination, and were dominantly expressed in the right mPFC hemisphere of susceptible mice. Log2 FC values are shown in a dot plot. Blue, resilient values; red, susceptible values. Lower panel Results are presented in box plot format (**p = 0.00000432 for susceptible left vs. susceptible right, t14 = -7.235, t-test, n = 8). c Upper panel: The genes Cldn11, Drd1a, Gal3st1, Mal, Mbp, Plp1, Scn4b, Tac1, and Ugt8a were associated with the GO term, action potential, and were dominantly expressed in the right hemisphere of susceptible mice. Log2 FC values are shown in a dot plot. Blue, resilient values; red, susceptible values. Lower panel: Results are presented in box plot format (**p = 0.00000462 for susceptible left vs. susceptible right, t16 = -6.756, t-test, n = 9). d Upper panel: The genes Drd1a, Fa2h, Fgf10, Nfib, Plp1, Sox5, and Trf were associated with the GO term, gliogenesis, and were dominantly expressed in the right hemisphere of susceptible mice. Log2 FC values are shown in a dot plot. Blue, resilient values; red, susceptible values. Lower panel: Results are presented in box plot format (**p = 0.0000522 for susceptible left vs. susceptible right, t12 = -6.114, t-test, n = 7). e Upper panel: The genes Bdnf, Camk2a, Egr2, Rasgrf1, and Vgf were associated with the GO term, neural synaptic plasticity, and were dominantly expressed in the left hemisphere of susceptible mice. Log2 FC values are shown in a dot plot. Blue, resilient values; red, susceptible values. Lower panel: Results are presented in box plot format (**p = 0.0000245 for susceptible left vs. right, t8 = 8.665, t-test, n = 5). f Upper panel: The genes Bdnf, Casp1, Igf2, Mef2c, Pde4d, Reln, Serpinf1, and Vip were associated with the GO term, cognition, and were dominantly expressed in the left hemisphere of susceptible mice. Log2 FC values are shown in a dot plot. Blue, resilient values; red, susceptible values. Lower panel: Results are presented in box plot format (**p = 0.0000276 for susceptible left vs. susceptible right, t14 = 6.096, t-test, n = 8). g Upper panel: The genes Anxa11, Fos, Fosb, Junb, Mef2c, Mt3, and Tnnc1 were associated with the GO term, response to metal ion, and were dominantly expressed in the left hemisphere of susceptible mice. Log2 FC values are shown in a dot plot. Blue, resilient values; red, susceptible values. Lower panel: Results are presented in box plot format (*p = 0.0148 for susceptible left vs. susceptible right, t12 = 2.844, t-test, n = 7). h Upper panel: The genes Adcyap1, Bdnf, Camk2a, Egr2, Itpka, Mef2c, Rasgrf1, Reln, Rims3, Slc1a3, Sphk1, and Vgf were associated with the GO term, synaptic transmission, and were dominantly expressed in the left hemisphere of susceptible mice. Log2 FC values are shown in a dot plot. Blue, resilient values; red, susceptible values. Lower panel: Results are presented in box plot format (**p = 0.0000000233 for susceptible left vs. susceptible right, t22 = 8.454, t-test, n = 12)

