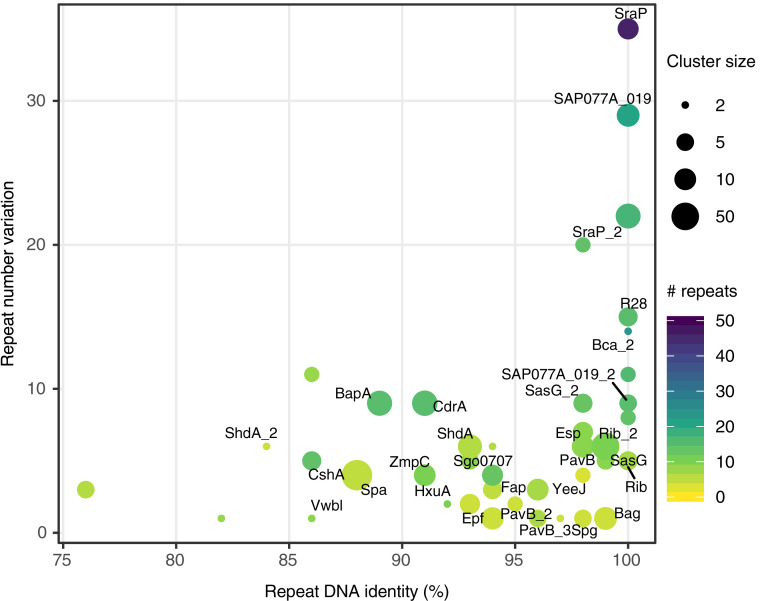
Fig. 6.
Repeat number variation in Periscope Proteins as a function of repeat sequence identity. The sequence identity of tandem repeats in the genome plotted against the variation in repeat number observed for each Periscope Protein cluster. The repeat number variation is calculated as the difference between the maximum and minimum observed repeat numbers in proteins within each cluster. The maximum number of repeats is shown as a viridis color scale. The repeat DNA identity is calculated as the maximum repeat sequence identity across proteins in each cluster. The number of proteins in each cluster is shown as point size. Names for the most relevant Periscope Protein clusters are shown as labels.

