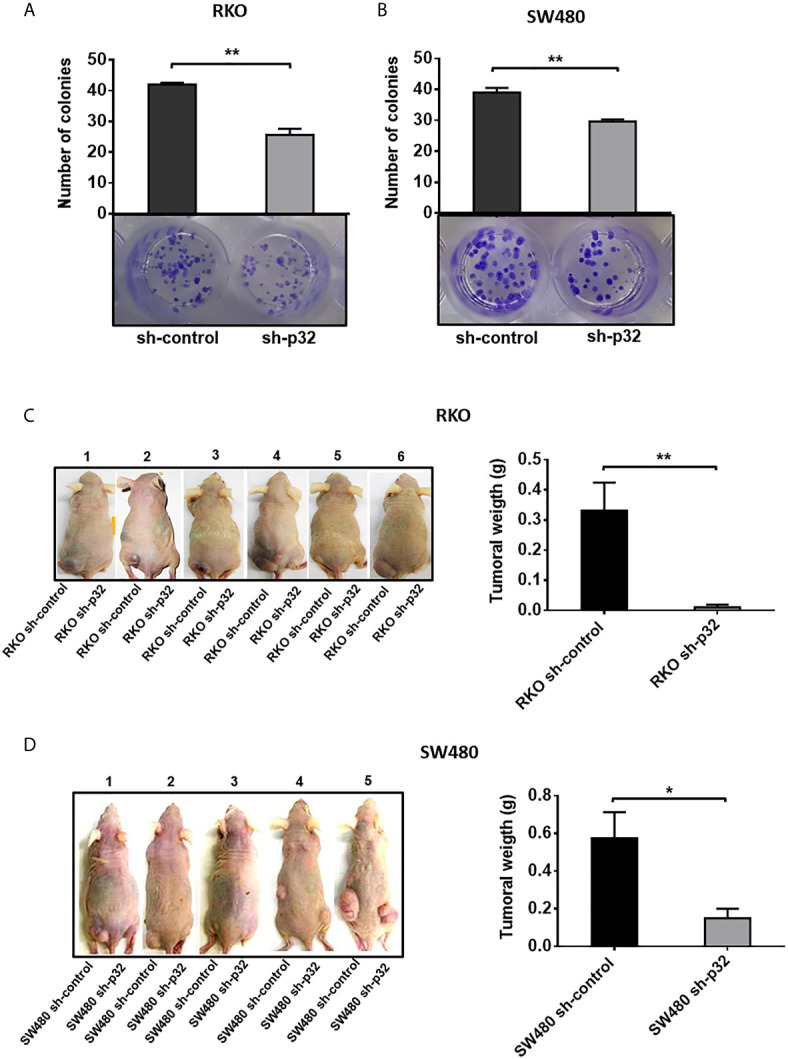
Figure 6.

Knockdown of p32 affects the clonogenic and tumorigenic capacity of RKO and SW480 cells. Colony formation assays for RKO sh-control and RKO-sh p32 cells (A) or SW480 sh-control cells and SW480 sh-p32 cells (B) were performed as described under the Material and Methods section. Representative photographs from 3 independent experiments are shown. The data is presented as the mean values ± SEM from three independent experiments, **p < 0.01. (C) The tumorigenic capacity of RKO sh-control and RKO sh-p32 cells was evaluated in 6 nude mice as described in the Materials and Methods section. Photographs taken of the experimental animals with tumors just after euthanasia are shown. The graph represents the mean ± SEM of the weights of tumors formed by the RKO sh-control or RKO sh-p32 cells on the 6 experimental animals, **p < 0.01. (D) The tumorigenic capacity of SW480 sh-control and SW480 sh-p32 cells was evaluated in 5 nude mice as described in the Materials and Methods section. Photographs taken of the experimental animals with tumors just after euthanasia are shown. The graph represents the mean ± SEM of the weights of tumors formed by the SW480 sh-control or SW480 sh-p32 cells on the 5 experimental animals, *p < 0.05.
