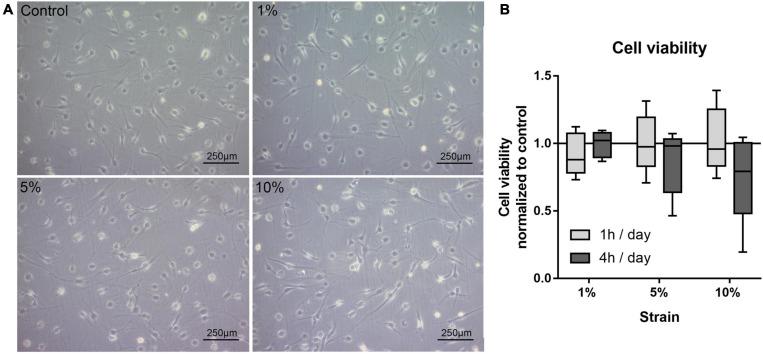
FIGURE 3.
(A) Representative images of bursa-derived cell morphology taken from control cells and mechanically loaded cells from area b (middle) in the silicon dish. Cells were stimulated for 4 h per day at 1, 5, and 10% strain with 1 Hz. Scale bar: 250 μm. (B) Cell viability of bursa-derived cells after 1 and 4 h of mechanical loading per day. The values are given as fold to the unstimulated control. Statistics: Dunn’s multiple comparison test for n = 5 individual donors.

