FIGURE 4.
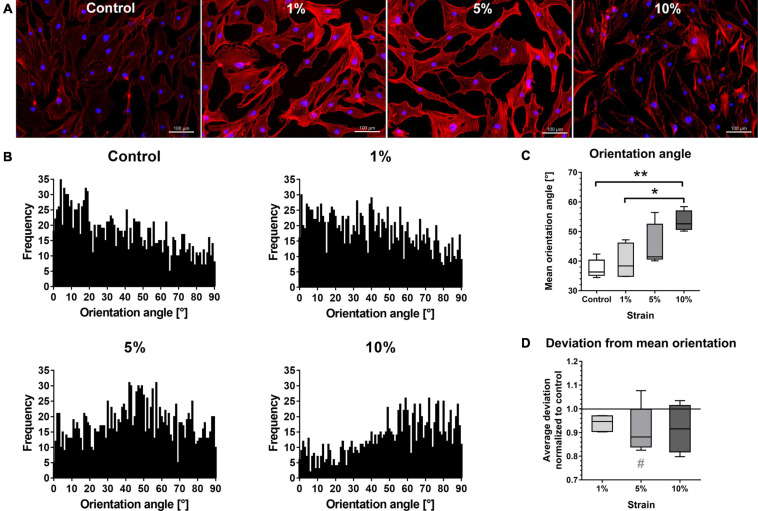
Morphology and orientation of bursa-derived cells stimulated at 3 days for 4 h per day at 1 Hz with 1, 5, and 10% strain compared to the unstimulated control. (A) Representative z-stack images of Phalloidin and DAPI staining of actin filaments for all loading and control conditions. Representative images derived from area b (middle) in the silicon dish. Left to right = tensional direction. Scale bar: 100 μm. (B) Total frequencies of the orientation angles measured using the FibrilTool macro from images taken at three positions (a, b, c) in the silicon dish from five individual donors (0° = loading direction; 90° = perpendicular to the loading direction). (C) Mean orientation angles of all loading conditions calculated from the mean orientation of each individual image and given as absolute degree values. (D) Average deviation from mean orientation angle calculated from the mean values of each individual image and given as fold to the unstimulated control (line at 1). Statistics: Dunn’s multiple comparison test for n = 5 individual donors. A spanning line with asterix marks significant differences with a p-value of <0.05 and a spanning line with two asterix marks significant difference with a p-value of <0.01. The gray # indicates trend significant differences with a p-value of < 0.1.

