FIGURE 5.
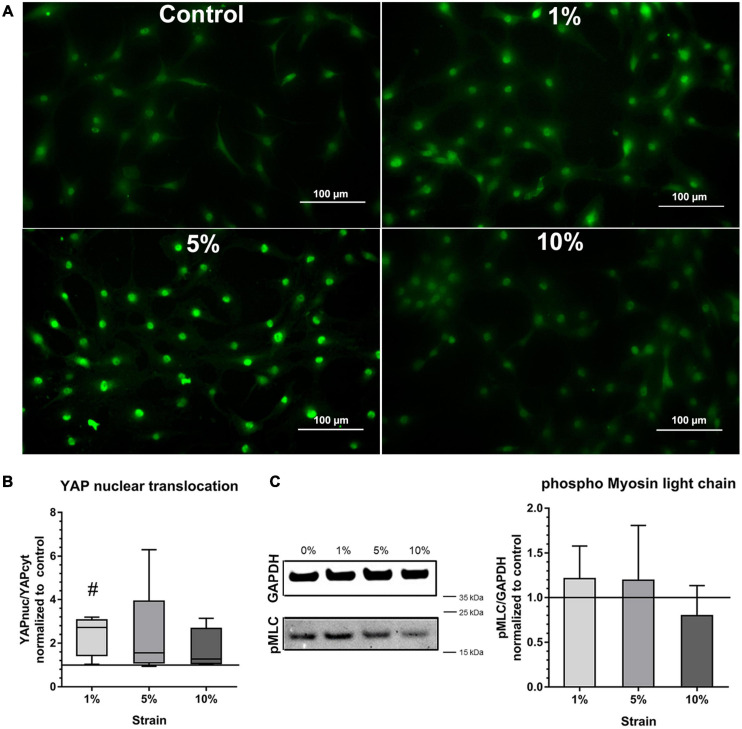
Mechano-transduction pathways in bursa-derived cells stimulated at 3 days for 4 h per day at 1 Hz with 1, 5, and 10% strain compared to the unstimulated control. (A) Exemplary images of YAP fluorescence staining for all loading and control conditions. These exemplary images resulted from bursa-derived cells with highest Yap nuclear translocation in the 1 and 5% group in the study. Exemplary images derived from area b (middle) in the silicon dish. Left to right = tensional direction. Scale: 100 μm. (B) YAP nuclear translocation calculated as the ratio between the YAP-positive nucleus area and the YAP-positive cytoplasm area and given as fold to the unstimulated control (line at 1). Statistics: Dunn’s multiple comparison test for n = 5 individual donors. The # indicates significant differences with a p < 0.05. (C) Representative images of pMLC bands and GAPDH reference bands from Western blot analysis. Images are cropped and original images are provided in Supplementary Materials. Images were taken at a wavelength of 800 nm using the Odyssey V3.0 software with a resolution of 42 μm and an intensity of 4 for GAPDH and 8 for pMLC. The bar graphs show pMLC quantification relative to GAPDH and given as fold to the unstimulated control (line at 1). Statistics: Dunn’s multiple comparison test for n = 4 (n = 3 for 5% group) individual donors.

