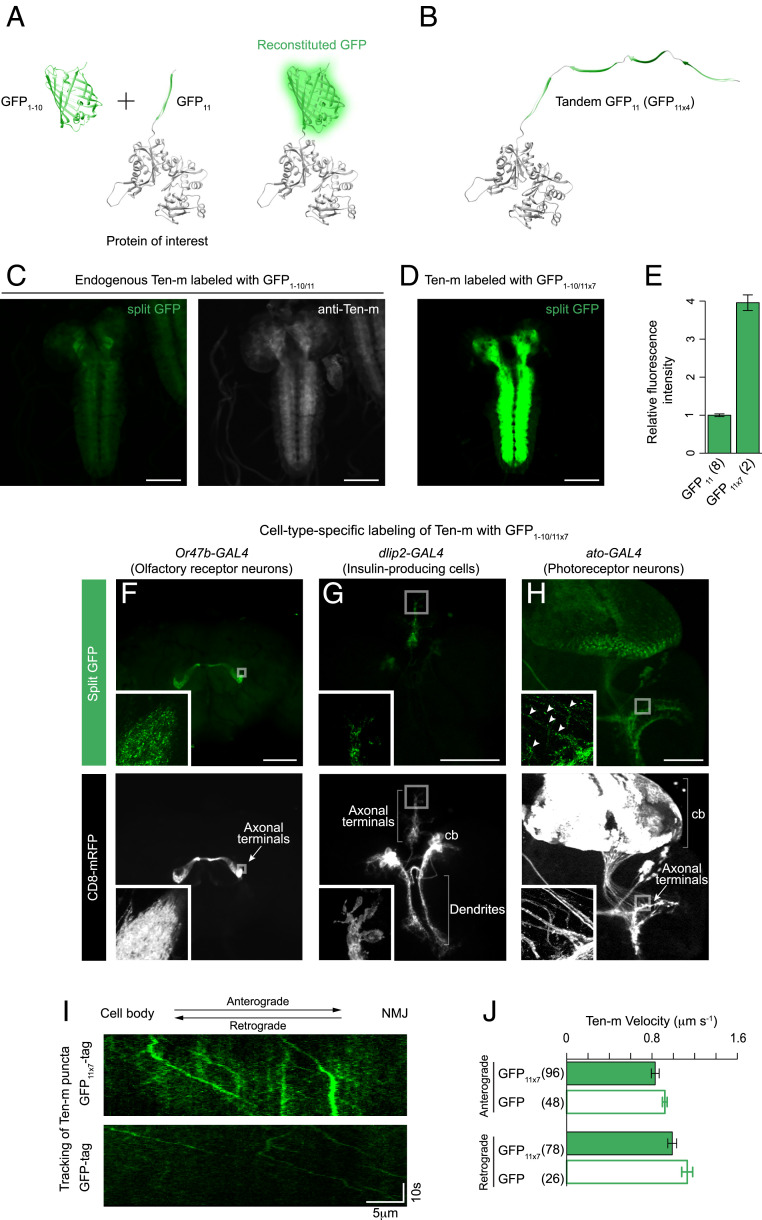
Fig. 1.
Labeling endogenously expressed proteins in subsets of neurons. (A and B) Schematic for split GFP labeling of a cellular protein. A protein of interest is labeled with the GFP11 fragment. It becomes fluorescent when the GFP1–10 fragment is expressed in the same cell. In this diagram, the N terminus of β-actin is fused with GFP11 or four copies of GFP11. (C and D) For the visualization of Ten-m, we crossed either the GFP11 or the GFP11 × 7 strain with a panneuronal expression line of GFP1–10. The distribution pattern of Ten-m tagged with GFP11 or GFP11 × 7 is indistinguishable from Ten-m detected with anti–Ten-m. Identical acquisition settings were used for the split GFP images for comparison. (E) Quantification of relative fluorescence intensity of Ten-m labeled with GFP11 or GFP11 × 7, measured by confocal microscopy. n = 2 to 8 larval brains. Error bars are SEM. (F–H) Cell-type–specific labeling of Ten-m proteins. Representative images of adult fly and larval brains showing cell-type–specific fluorescence of Ten-m (Top) and a CD8 membrane marker (Bottom). We crossed the GFP11 × 7 protein trap line of ten-m with different expression lines for GFP1–10. The following GAL4 lines were used to drive UAS-GFP1–10 expression: (F) Or47b-GAL4 (ORN), (G) dlip2-GAL4 (IPCs), and (H) ato-GAL4 (photoreceptor neurons). (H, Inset) Arrowheads mark Ten-m puncta along the axon shafts. (I) Tracking of Ten-m tagged with either GFP11 × 7 (with an expression of GFP1–10 driven by elav-GAL4; Top) or full-length EGFP (Bottom) in larval motor axons (see also Movie S2). Kymograph displays the trajectory of Ten-m puncta. (J) Quantifying the anterograde and retrograde velocity of Ten-m labeled with GFP11 × 7 or full-length EGFP. The number of puncta that we analyzed in each case is indicated in the figure. Error bars are SEM. All images in this and subsequent figures are maximum Z-projections of confocal images. Insets show a higher magnification of boxed regions (single Z-sections). cb, cell bodies. (Scale bars, 100 μm in C through F.)

