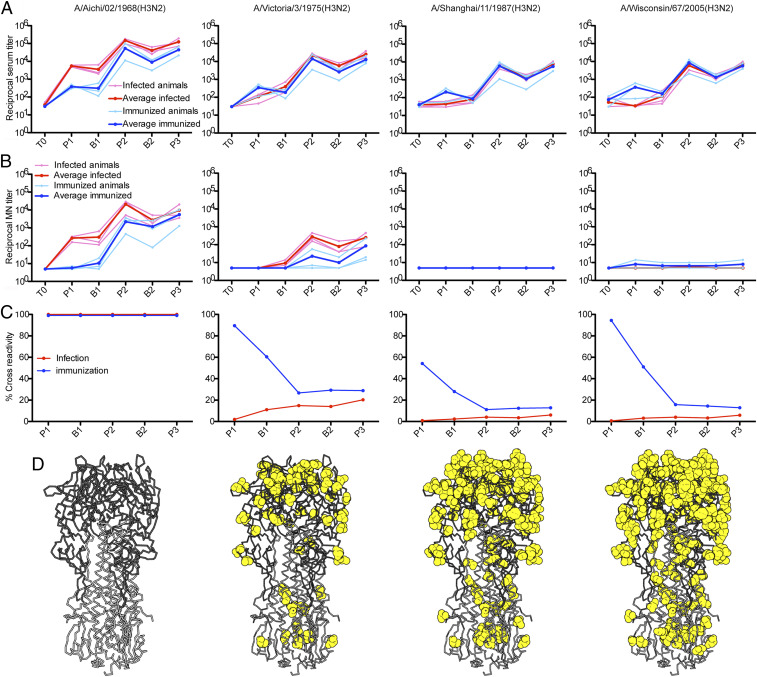
Fig. 2.
Serologic profiles of infected and immunized cohorts. (A) Reactivities of the macaque sera to the indicated HA proteins were measured by ELISA and the reciprocal serum titers are graphed. All ELISA data are in SI Appendix, Fig. S2. (B) Neutralization of selected influenza viruses. Macaque sera were assayed for neutralizing activity by microneutralization assay, and the reciprocal neutralizing titers graphed. All microneutralization data are in SI Appendix, Fig. S3. (C) Percent cross-reactivity of macaque serum. Using the averaged ELISA titers for each cohort, we calculated the percentage of the HA directed serum response that reacted with heterologous HAs [(heterologous titer ÷ H3-HK-1968 titer)*100]. All percent cross-reactivity data are in SI Appendix, Fig. S4. For each panel, the time points on the x axis correspond to Fig. 1 and are as follows: time 0 (T0), peak 1 (p1), baseline 1 (b1), peak 2 (p2), baseline 2 (b2), and peak 3 (p3). (D) Differences from A/Aichi/02/1968(H3N2), mapped to the HA structure (Protein Data Bank [PDB] 2VIU), are shown as yellow spheres. The HA head domain is in dark gray; the stem, in light gray.

