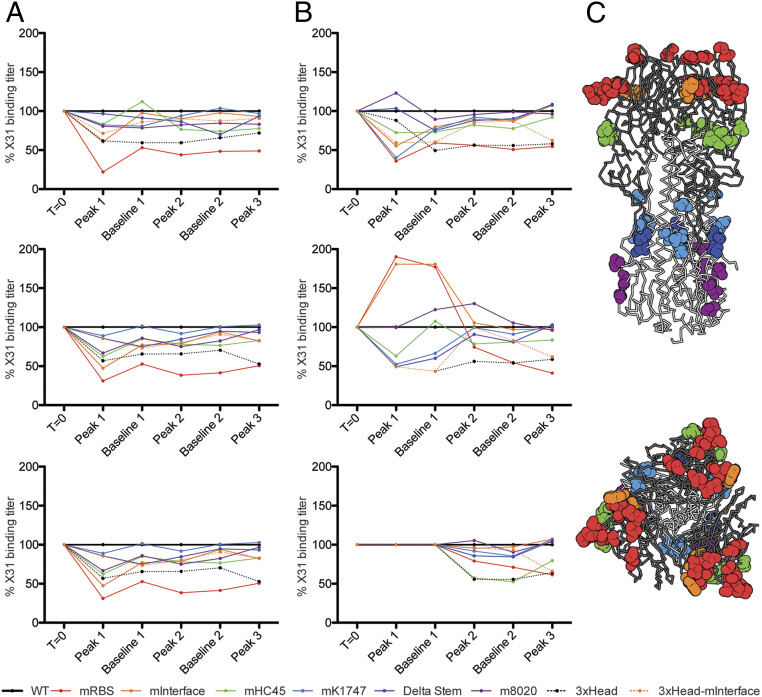
Fig. 3.
Route of exposure influences the distribution of epitopes bound by serum antibodies. We produced a panel of seven HA variants each with mutations that disrupt a single epitopic region, and trimeric HA head domains (3xHead) (SI Appendix, Fig. S5). Using ELISA ED50s (SI Appendix, Fig. S6), we calculated and graphed the percent serum binding compared to wild-type H3-HK-1968. (A) The infected cohort. (B) The immunized cohort. For each graph panel, the time points on the x axis correspond to Fig. 1 and are as follows: time 0 (T0), peak 1 (p1), baseline 1 (b1), peak 2 (p2), baseline 2 (b2), and peak 3 (p3). (C) Locations of mutations mapped to the structure of the HA trimer (PDB 2VIU). Sites that were mutated are shown in spheres that are colored to match the key for the graphs. The HA head domain is shown in dark gray, and the stem domain is shown in light gray. (Top) A side view of the molecule. (Bottom) A top view of HA looking down upon the apex of the molecule and the receptor binding domain.

