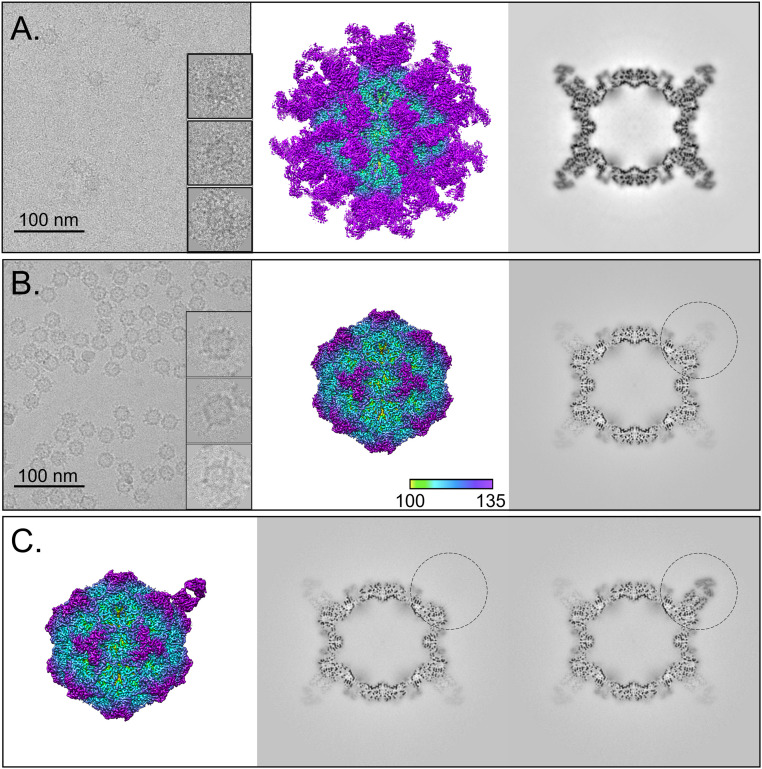
Fig. 1.
Full-Fab and low-Fab data reconstructed with and without icosahedral symmetry averaging. (A and B, Left) In the cryo-EM micrographs, an excess of Fab in the incubation results in Fab attached to most capsid binding sites, which can be seen as full-Fab complexes that have a spidery appearance. In comparison, complexes resulting from lower ratio of Fab:virus incubation have obvious low-fab occupancy (Scale bar, 100 nm). (A and B, Center and Right) The 3.2- and 2.3-Å icosahedrally averaged cryo-EM maps of Fab 14–CPV full-Fab and low-Fab complexes are surface rendered and colored according to radius, with key Inset. The Center section of each corresponding map shows the magnitude of Fab density relative to that of the capsid. (C) Asymmetric reconstruction of low-Fab data using localized classification approach. Although there were many more Fab-unoccupied particles per particle, we intentionally selected only as many Fab-unoccupied subparticles as there were Fab-occupied subparticles from each particle. (Left) A 2.4-Å surface-rendered asymmetric map is colored according to radius (as above) and shown with (Center and Right) the central sections of the fab-unoccupied and -occupied subparticles (black circle) in the context of the capsid. The low-magnitude Fab density seen in other positions in the Center section corresponds to an average of the other 10 Fab molecules averaged over the remaining 59 sites.

