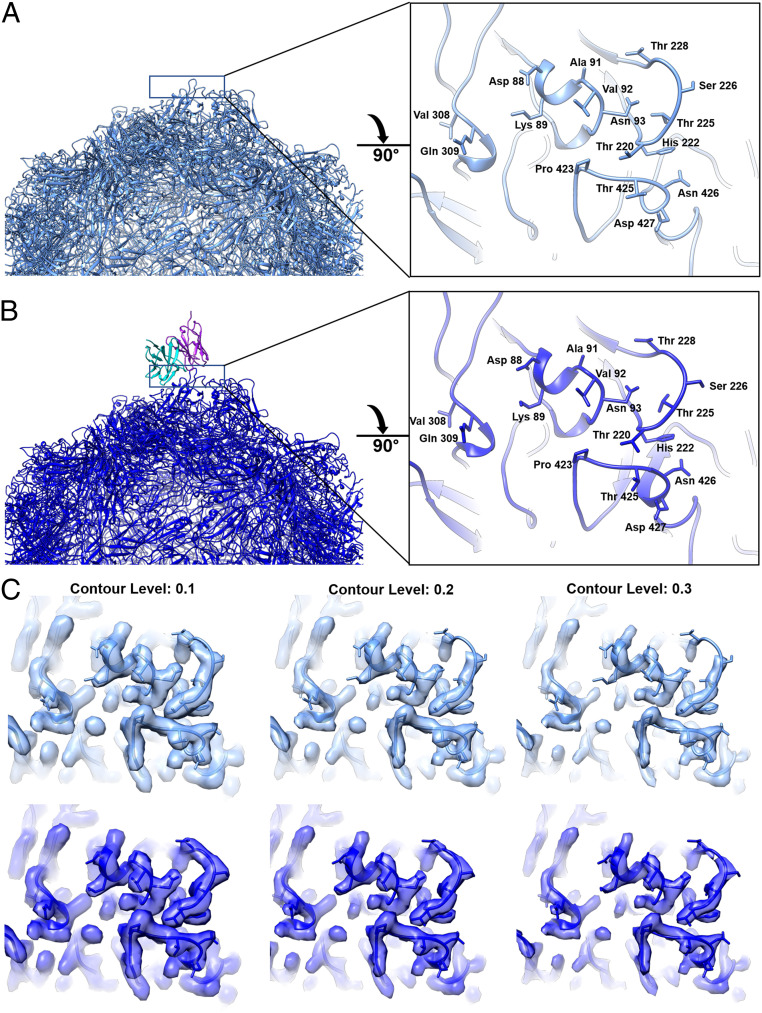
Fig. 2.
Structure of unbound and bound epitopes on the virus surface. (A and B, Left) Half capsid ribbon structures of capsid with unbound (A) (medium blue) and bound (B) (dark blue) Fab 14 heavy (cyan) and light chains (purple). (A and B, Right) Zoomed view of area (black solid line) rotated 90° from the panel A and B, Left to view the Fab binding footprint on the capsid surface with (B) antibody structure removed for visualization. The difference in the 228 loop is also displayed in two supplemental movies (Movies S1 and S2). (C) Same zoomed view of the conformational epitope surface rendered for unbound (medium blue) and bound (dark blue) with increasing contours of the map from left to right. This panel illustrates the weak, discontinuous density in the unbound epitope 228 loop compared to the stabilized continuous density in the Fab-bound epitope.

