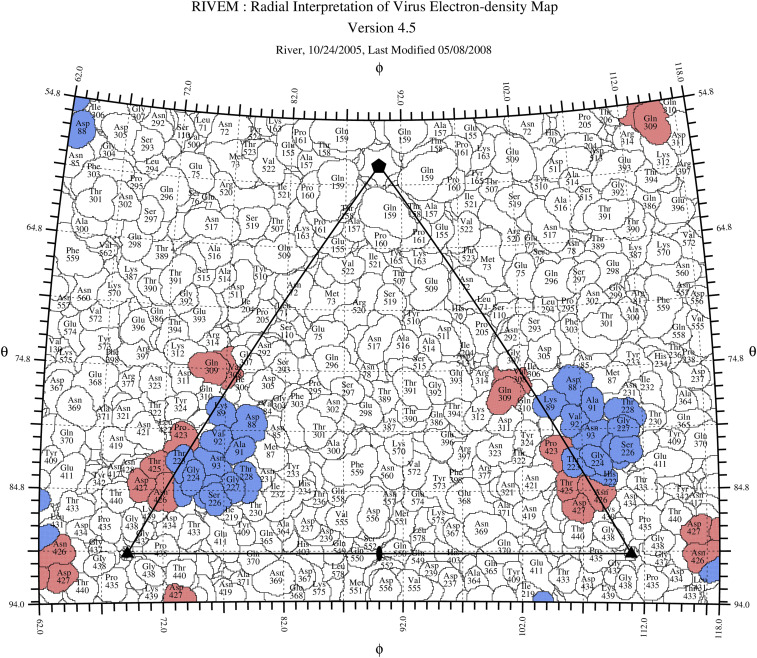
Fig. 3.
Road map of the Fab 14 footprint on the CPV surface. The capsid surface is shown as a stereographic projection where the polar angles phi and theta represent the latitude and longitude of a point on the virus surface (31). The virus surface is represented as a quilt of amino acids (32), and the icosahedral asymmetric unit of the virus is indicated by the triangular boundary. The footprint of Fab 14 has contributions from symmetry-related copies of the capsid protein (red and blue) as in Fig. 2 and SI Appendix, Fig. S4.

