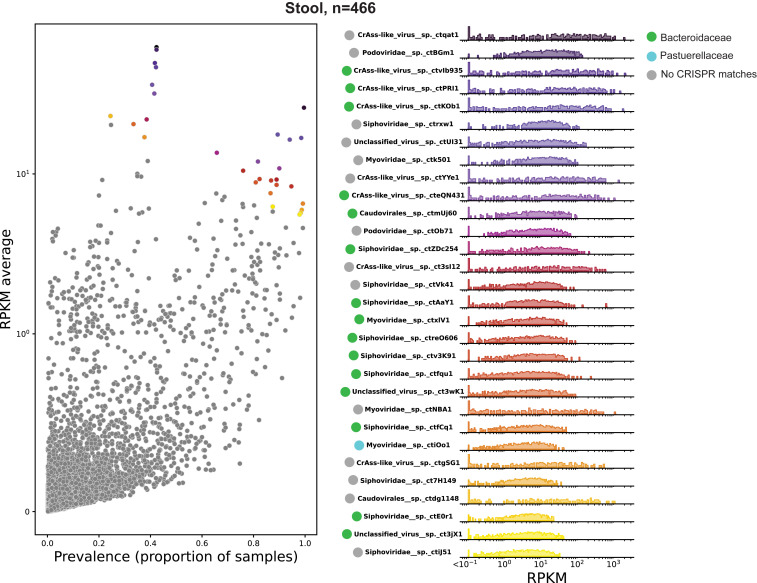
Fig. 3.
Most common viruses, Stool (Gut). (Left) A scatter plot of RPKM (a measure of relative read abundance for a given virus OTU, y-axis) versus prevalence (proportion of samples with >0.1 RPKM, x-axis). For display purposes, the y-axis is a linear scale from 0 to 1 (100) and log10 above 1. The top 30 most commonly abundant virus OTUs (based on the product of coordinates) are colored. (Right) Histogram and rug plot of RPKM values across all samples for the most commonly abundant virus OTUs. Colors of dots in the Left correspond with the colors in the Right. The x- and y-axis are log scale. RPKM values below 0.1 are binned at the left extremity of the plots for display purposes.

