Fig. 1.
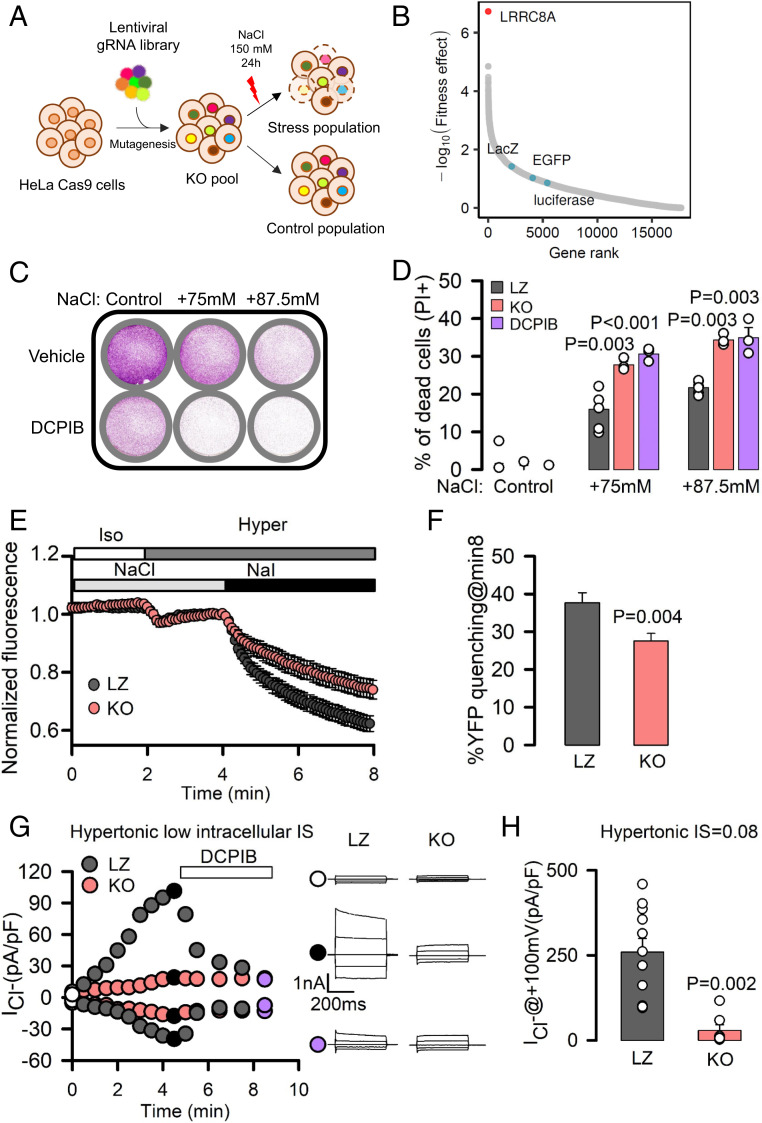
LRRC8A activation is essential for cell fitness upon hypertonicity. (A) Schematic diagram of unbiased CRISPR/Cas9 genome-wide genetic screening to identify genes relevant for adaptation to high osmolarity. (B) Representation of the MAGeCK per-gene fitness effect score (–log10 RRA score). A higher fitness effect indicates a higher degree of importance for cell viability upon hyperosmotic stress. Gene name of LRRC8A is indicated, together with the name of nontargeting controls (LacZ, EGFP, luciferase, blue dots). (C and D) Crystal violet staining or PI staining (to monitor cell death) of LZ, LRRC8A-KO, and HeLa cells treated with DCPIB and exposed to different doses of hypertonic stress. P values determined by one-way ANOVA followed by post hoc Dunnett’s test versus LZ control group. (E) Mean ± SEM. YFP fluorescence changes (normalized to the baseline in isotonic conditions) in LZ and KO HeLa cells transiently transfected with halide-sensitive YFP. Addition of isotonic and hypertonic bathing solutions containing NaCl or NaI is indicated by boxes at the top of the recordings. (F) Percentage of YFP quenching measured 8 min after the addition of NaI. Mean ± SEM (LZ, n = 66; KO, n = 59). P values were determined by two-tailed Student’s t test. (G) Time course of whole-cell chloride currents recorded at –100 mV and +100 mV in LZ (gray) and KO (red) HeLa cells dialyzed with hyperosmotic solutions with an IS of 0.08 and then exposed to hypertonic solutions followed by exposure to 36 μM DCPIB. (Right) Families of chloride currents measured at the points indicated in the Left. Cells here held at 0 mV and pulsed from –100 mV to +100 mV in 50-mV steps. (H) Maximal mean current densities measured in LZ and KO HeLa cells under the experimental conditions shown in G. P values determined by Student’s t test.

