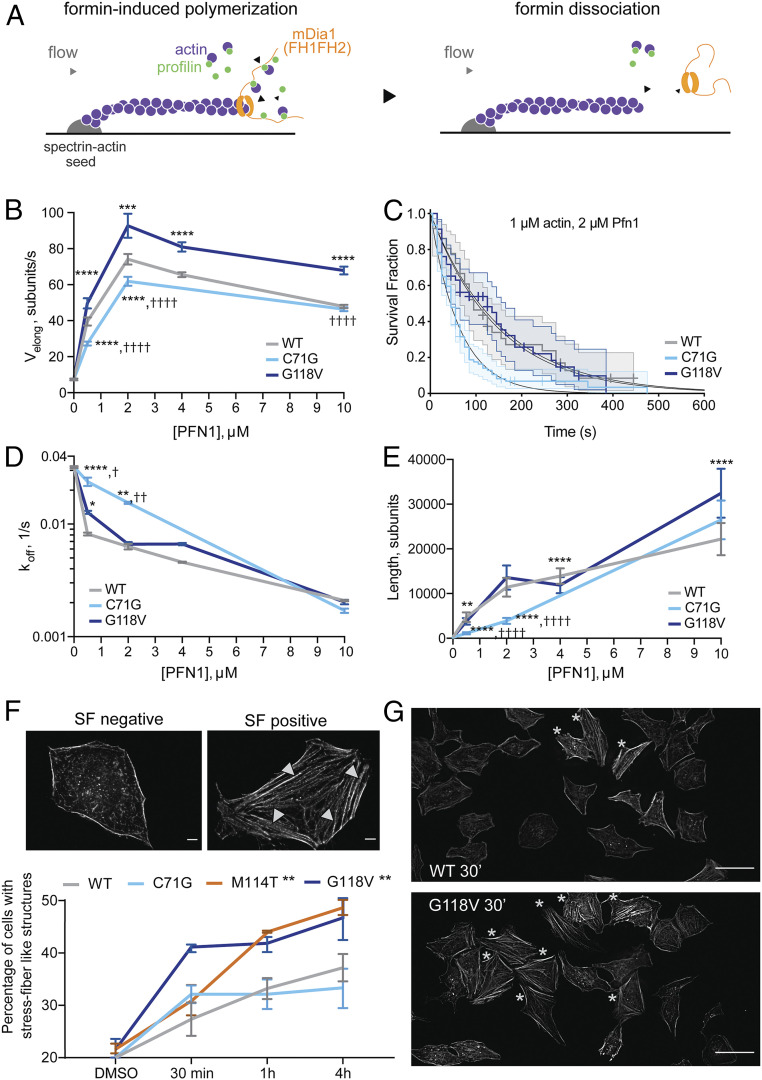
Fig. 2.
ALS-linked mutations have differential effects on formin-induced actin assembly. (A) Actin filaments (1 µM actin, 10% Alexa488-labeled) elongate from surface-anchored spectrin–actin seeds in a microfluidics platform designed to measure actin elongation with purified proteins. Upon exposure to a solution of recombinant mDia1(FH1-FH2-DAD), the mDia1 FH2 domain associates with the barbed end of actin, and the mDia FH1 domain associates with actin-bound PFN1, resulting in accelerated actin filament elongation (Left). Upon formin dissociation, the barbed end reverts to slower elongation (Right). This assay was used to determine both formin-induced actin filament elongation rates, and formin processivity in the presence of PFN1 WT (gray), PFN1 C71G (cyan), and PFN1 G118V (dark blue). (B) The rate of actin elongation (Velong; subunits per second) at the barbed end is plotted as a function of PFN1 variant and concentration (micromolar). Each data point represents the mean ± SD of n = 20 to 88 filaments, t test with Bonferroni correction. (B, D, E): *difference from WT; †difference from G118V; *,†P < 0.05; **,††P < 0.01; ***,†††P < 0.001; and ****,††††P < 0.0001. (C) The survival fraction of mDia1(FH1-FH2-DAD) that remains bound to the actin barbed end over a 600 s time course was determined as a function of PFN1 variant and concentration (shown is 2 µM PFN1). Decay curves were fitted to a single exponential function to obtain the formin dissociation rate (koff). Each curve shows n = 36 to 94 filaments. Log-rank test: WT versus G118V, P = 0.894; WT versus C71G, P = 0.000765; and G118V versus C71G, P = 0.000503. (D) mDia1 koff (from C) are plotted as a function of PFN1 as in B; n = 24 to 138 filaments, log-rank test, P values adjusted with Bonferroni correction: *difference from WT; †difference from G118V. (E) Mean formin-induced actin filament length (Velong/koff) ± SD; n = 20 to 138 filaments, t test with Bonferroni correction. (F) HeLa cells expressing V5-PFN1 variants were treated with 10 µM IMM-01 and assessed for the presence of actin stress fiber (SF)–like structures with phalloidin. An SF-negative and -positive cell are shown. (Scale bar, 5 µm.) Only four fibers are denoted by arrowheads for clarity. The percentage of SF-positive cells for each line at the indicated time point is shown (n = 3 biological replicates, mean ± SEM, two-way ANOVA, and Dunnet’s multiple comparison test for difference from the WT cell line, **P < 0.01). (G) The indicated cell line is stained with phalloidin after 30 min of IMM-01 treatment. Stars denote SF-positive cells. (Scale bar, 50 µm.)

