Fig. 6.
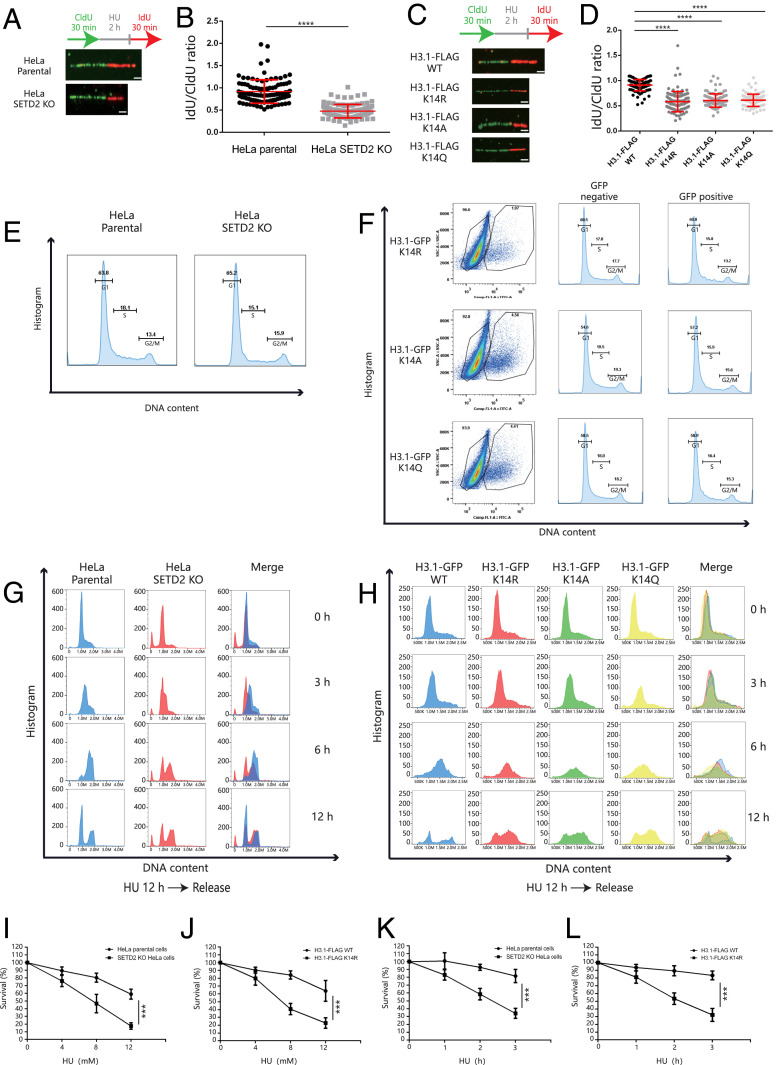
SETD2-induced H3K14me3 is required for stalled forks restart. (A) HeLa parental cells or SETD2-KO HeLa cells were pulse labeled with 40 μM CldU for 30 min, treated with 5 mM HU for 2 h, and then released in media containing 100 μM IdU for 30 min. The CldU and IdU track lengths were measured using ImageJ software. (Scale bar, 1 μm.) (B) The IdU/CldU ratio. At least 200 fibers were counted. The means ± SD are shown in the dot plot relative to one representative experiment, and Student’s t test was used for the statistical analysis. ****P < 0.0001. (C) HeLa cells expressing Flag-H3.1 WT, H3.1K14R, H3.1K14A, or H3.1K14Q were pulse labeled with 40 μM CldU for 30 min, treated with 5 mM HU for 2 h, and then released in media containing 100 μM IdU for 30 min. The CldU and IdU track lengths were measured using ImageJ software. (Scale bar, 1 μm.) (D) The IdU/CldU ratio. At least 200 fibers were counted. The means ± SD are shown in the dot plot relative to one representative experiment, and Student’s t test was used for the statistical analysis. ****P < 0.0001. (E) HeLa parental cells and SETD2-KO HeLa cells were harvested for flow cytometry analysis. The histograms show the cell-cycle distribution. (F) HeLa cells were transfected with GFP-H3.1K14R, H3.1K14A, and H3.1K14Q and harvested after 48 h for flow cytometry analysis. The histograms show the cell-cycle distribution of HeLa cells expressing GFP-H3.1K14R, H3.1K14A, and H3.1K14Q (GFP positive) and normal HeLa cells (GFP negative). (G) HeLa parental cells or SETD2-KO HeLa cells were treated with 4 mM HU for 12 h and then released in fresh media for up to 12 h. Cells were harvested at the indicated time for flow cytometry analysis. The histograms show the cell-cycle distributions. (H) HeLa cells expressing GFP-H3.1 WT, H3.1K14R, H3.1K14A, or H3.1K14Q were treated with 4 mM HU for 12 h and then released in fresh media for up to 12 h. Cells were harvested at the indicated time for flow cytometry analysis. The histograms show the cell-cycle distributions. (I) HeLa parental cells or SETD2-KO HeLa cells were treated with indicated doses of HU for 2 h and analyzed by colony formation assay. The cell survival of HeLa parental cells and SETD2-KO HeLa cells in “0” was normalized to 1. The data represent the means ± SD (n = 3). ***P < 0.001 (Student’s t test). “0” indicates the cells without HU treatment. (J) HeLa cells expressing FLAG-H3.1 WT or H3.1K14R were treated with indicated doses of HU for 2 h and analyzed by colony formation assay. The cell survival of Flag-H3.1 WT HeLa cells and H3.1K14R HeLa cells in “0” was normalized to 1. The data represent the means ± SD (n = 3). ***P < 0.001 (Student’s t test). “0” indicates the cells without HU treatment. (K) HeLa parental cells or SETD2-KO HeLa cells were treated with 8 mM HU for indicated time and analyzed by colony formation assay. The cell survival of HeLa parental cells and SETD2-KO HeLa cells in “0” was normalized to 1. The data represent the means ± SD (n = 3). ***P < 0.001 (Student’s t test). “0” indicates the cells without HU treatment. (L) HeLa cells expressing FLAG-H3.1 WT or H3.1K14R were treated with 8 mM HU for indicated time and analyzed by colony formation assay. The cell survival of FLAG-H3.1 WT HeLa cells and H3.1K14R HeLa cells in “0” was normalized to 1. The data represent the means ± SD (n = 3). ***P < 0.001 (Student’s t test). “0” indicates the cells without HU treatment.

