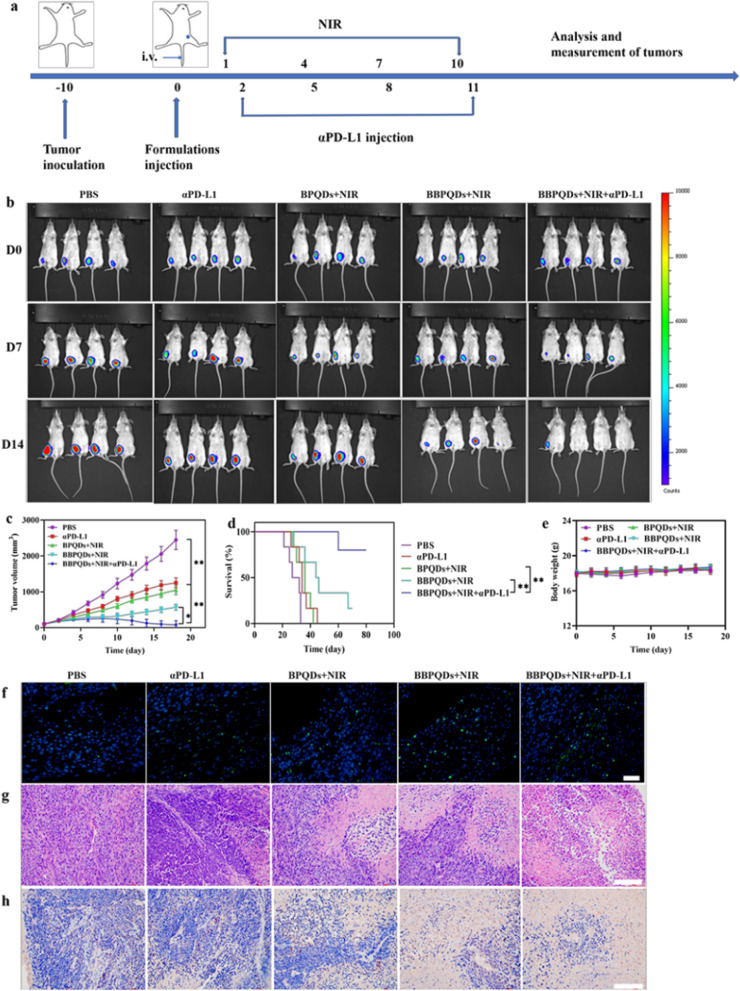
Fig. 5.
The therapeutic effect on primary tumors with photothermal immunotherapy strategy. a Schematic illustration of the animal experimental design for primary tumors. b Typical in vivo bioluminescence images of tumor burdens on day 0, day 7 and day 14. c The primary tumor growth curves under various treatments. d Survival curves of tumor-bearing mice after various treatments. e Body weight profiles of tumor-bearing mice during treatment. Representative fluorescent TUNEL (f) and H&E (g) stained images of tumor tissues in different treatment groups at the end of the experiments. Scale bar, 20 μm (TUNEL); scale bar, 100 μm (HE). h Immunohistochemical images showing the expression of Ki-67 in 4T1 tumor tissue. Scale bar, 100 μm

