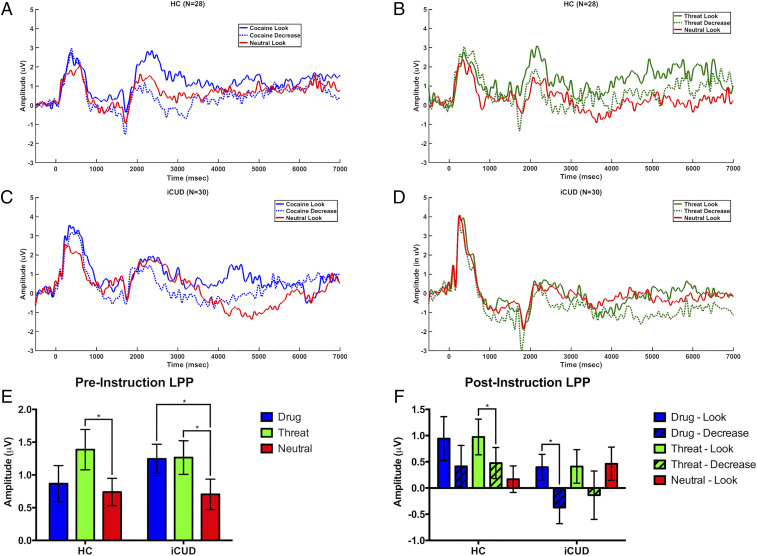
Fig. 2.
Event-related potentials waveforms for HC (A and B) and iCUD (C and D). These waveforms reflect an averaged reactivity to each condition, and 0 msec reflects the onset of each picture. Note that “Look” or “Decrease” instruction was provided at 1,500 msec. Graphical representation of LPP amplitudes for the pre- (averaged amplitude during 400 to 1,000 msec) and postinstruction (averaged amplitude during 2,500 to 7,000 msec) phases are also presented (E and F).

