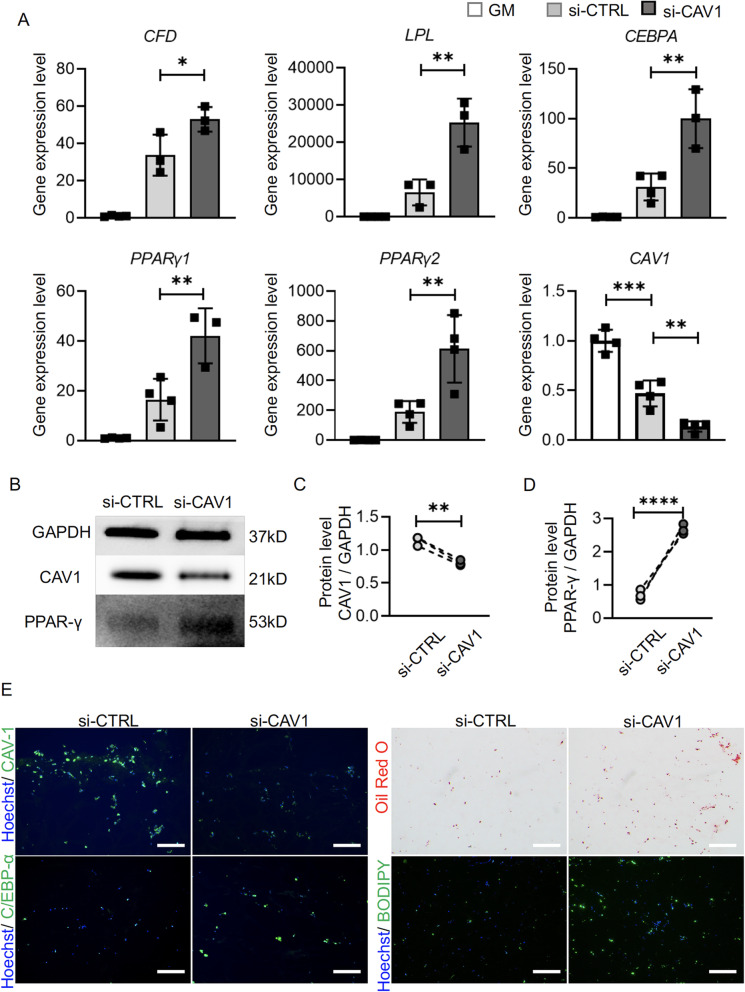
Fig. 6.
Influence of CAV1 gene expression knockdown on hBMSC adipogenesis in soft and stiff scaffolds. Control siRNA (si-CTRL) and CAV1 siRNA (si-CAV1) were used. a Relative expression levels of adipogenic marker genes and CAV1. Data were normalized to that in GM group. N= 4. b, c, d Western blot and semi-quantitative analysis of CAV1 and PPAR-γ levels. N = 3. e Immunofluorescence analysis of CAV1 and C/EBP-α levels. Bar = 100 μm. Oil Red O and BODIPY staining of lipid deposition in cells. Bar = 100 μm. *p<0.05, **p<0.01, ***p<0.001, ****p<0.0001

