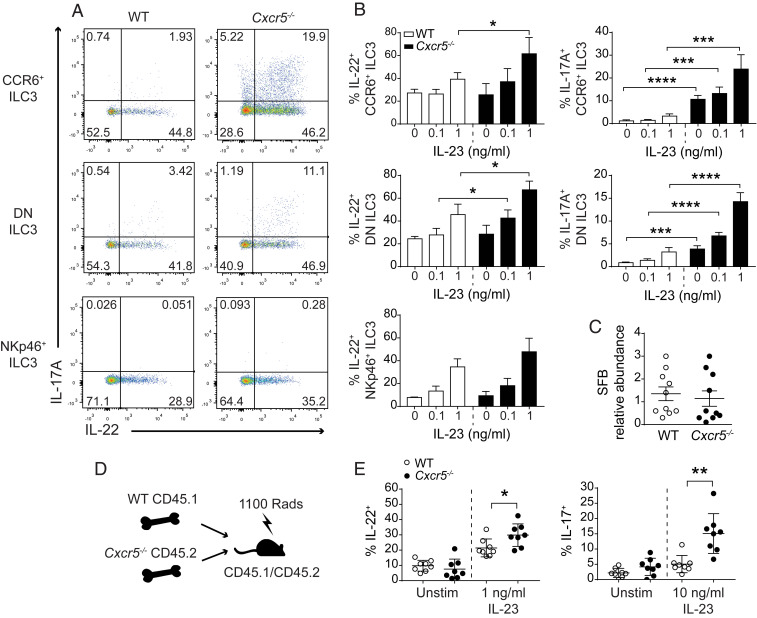
Fig. 2.
CXCR5 regulates cytokine production in ILC3. Representative flow cytometry plots (A) and bar graphs (B) of IL-17 and IL-22 production in CCR6+, DN, and NKp46+ ILC3 stimulated ex vivo for 3 h, with increasing doses of IL-23 as indicated (n = 4). Flow cytometry plots show ILC3 stimulated with 1 ng/mL IL-23. (C) qPCR analysis showing the relative abundance of SFB in feces collected from WT and Cxcr5−/− mice (n = 10). (D) Schematic representation of mixed bone marrow chimera construction. (E) Frequency of IL-17– and IL-22–producing LTi-like cells isolated from the SIs of mixed bone marrow chimeras and stimulated in vitro (n = 8). Bar graphs show mean ± SEM. *P < 0.05, **P < 0.01, ***P < 0.001, and ****P < 0.0001 (unpaired Student’s t test). Data shown are representative of three independent experiments (A and B) or are pooled from two independent experiments (C and E).

