Fig. 3.
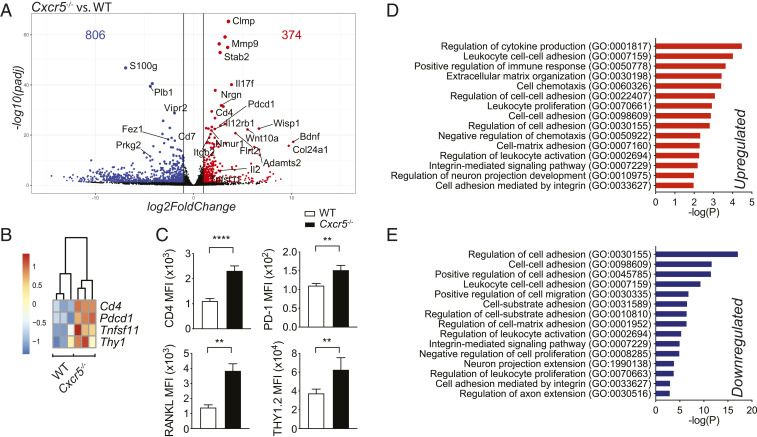
Gene expression profiling of Cxcr5−/− LTi-like cells. (A) Volcano plot showing differentially expressed genes (P value adjusted < 0.01 and more than twofold change in Cxcr5−/− versus WT LTi-like cells). (B) Heat maps showing Cd4, Pdcd1, Tnfsf11, and Thy1 expression in WT and Cxcr5−/− mice (n = 3). (C) Antibody staining for CD4, PD-1, RANKL, and Thy1.2 in WT and Cxcr5−/− mice (n = 3 to 4). (D and E) Gene ontology (GO) analysis of up-regulated and down-regulated differently expressed genes in Cxcr5−/− LTi-like cells compared to WT cells. Bar graphs show mean ± SEM. **P < 0.01 and ****P < 0.0001 (unpaired Student’s t test). Data shown are representative of two independent experiments (C).

