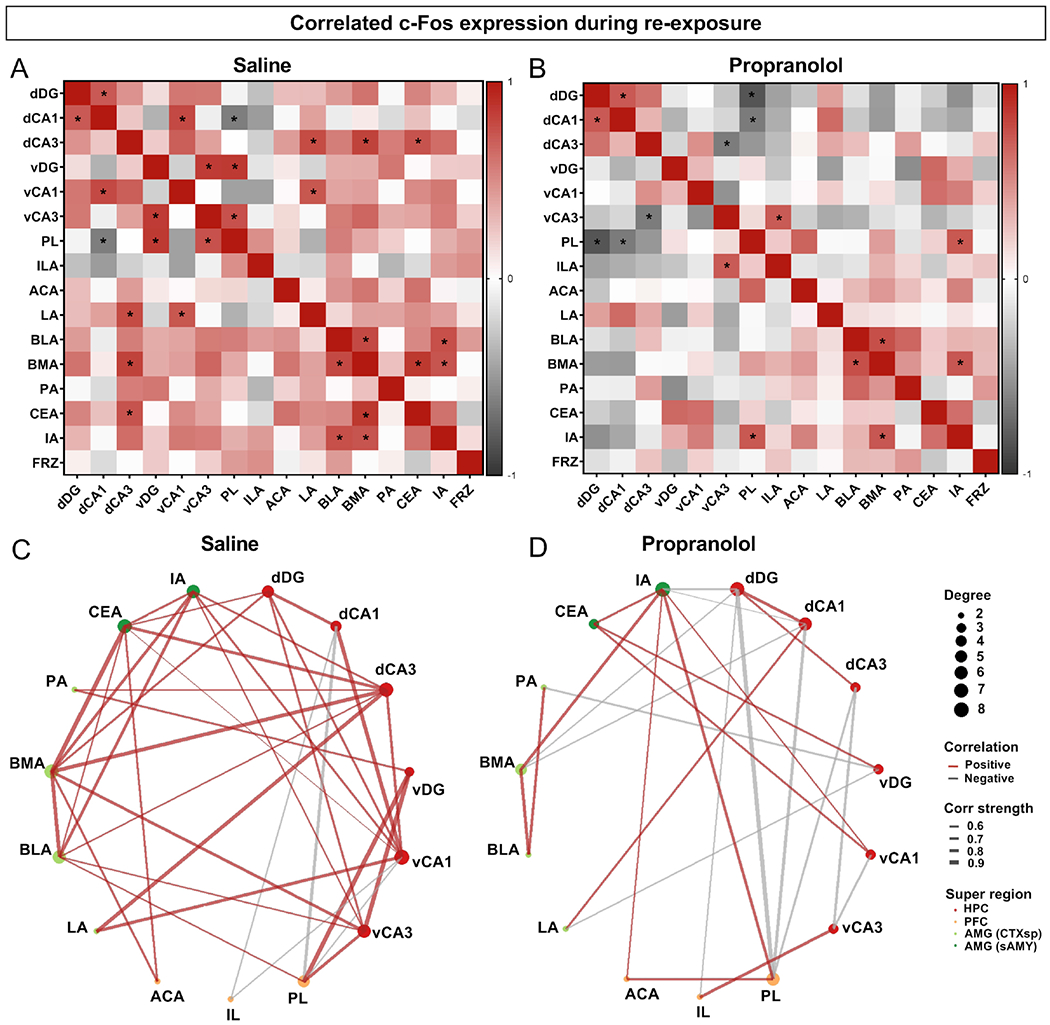
Figure 6. Propranolol alters correlated activity between hippocampal, prefrontal and amygdalar regions and the correlation of memory trace reactivation with freezing levels.

(A) Correlation analysis of c-Fos+ activity across brain regions in the saline group. (B) Correlation analysis of c-Fos+ activity across brain regions in the propranolol group. Square color reflects the Pearson correlation coefficient and asterisks represent a significant correlation. Correlations with R>0.5 (in red) or R<−0.5 (in grey) are displayed in (C) for mice that received saline and in (D) for mice that received propranolol, with line thickness being proportional to strength of correlation (R value). (n = 9 male mice per group). Sal, saline; P, propranolol; dDG, dorsal dentate gyrus; dCA1, dorsal CA1; dCA3, dorsal CA3; vDG, ventral dentate gyrus; vCA1, ventral CA1; vCA3, ventral CA3; ILA, infralimbic area; ACA, anterior cingulate area; LA, lateral amygdalar nucleus; BLA, basolateral amygdalar nucleus; BMA, basomedial amygdalar nucleus; PA, posterior amygdalar nucleus; CEA, central amygdalar nucleus; IA, intercalated amygdalar nucleus.
