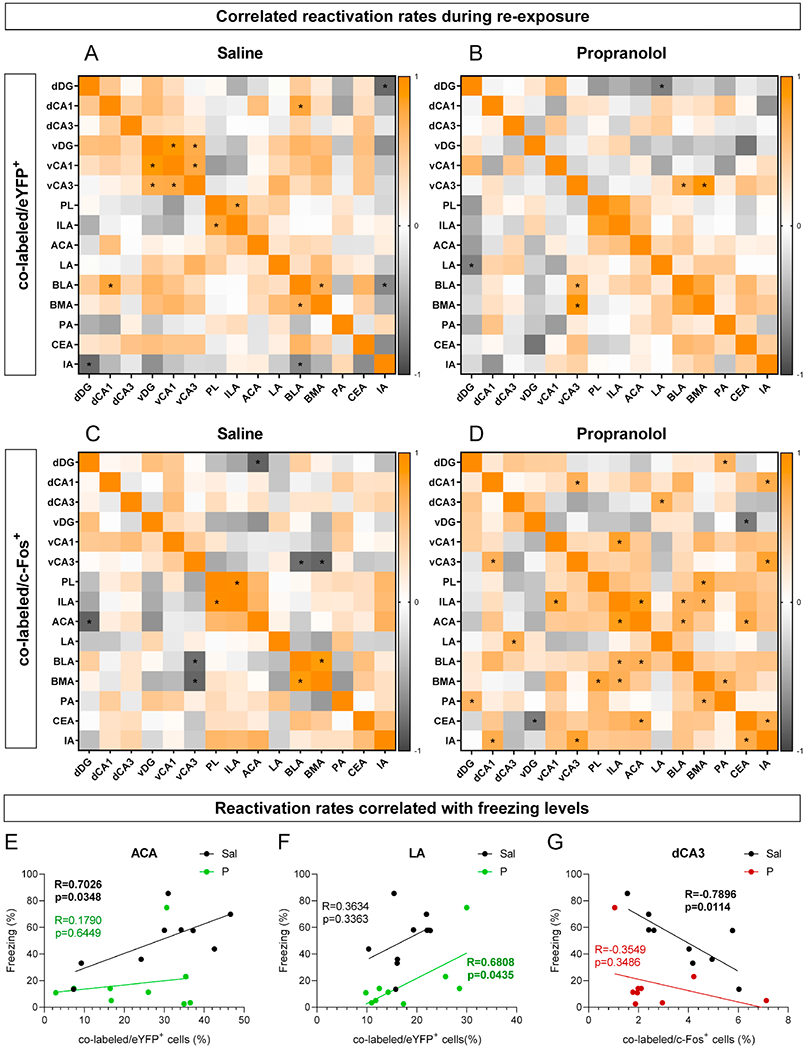
Figure 7. Correlations between memory reactivation rates across regions and with behavior.

(A) Correlation of percentage of co-labeled/eYFP+ cells during context re-exposure after administration of saline. (B) Correlation of percentage of co-labeled/eYFP+ cells during context re-exposure after administration of propranolol. (C) Correlation of percentage of co-labeled/c-Fos+ cells during context re-exposure after administration of saline. (D) Correlation of percentage of co-labeled/c-Fos+ cells during context re-exposure after administration of propranolol. Square color reflects the Pearson correlation coefficient and asterisks represent a significant correlation. (E) Correlation between percentage of co-labeled/c-eYFP+ cells in the ACA and freezing levels. (F) Correlation between percentage of co-labeled/eYFP+ cells in the LA and freezing levels. (G) Correlation between percentage of co-labeled/c-Fos+ cells in the dCA3 and freezing levels. (n = 9 male mice per group). Sal, saline; P, propranolol; dDG, dorsal dentate gyrus; dCA1, dorsal CA1; dCA3, dorsal CA3; vDG, ventral dentate gyrus; vCA1, ventral CA1; vCA3, ventral CA3; ILA, infralimbic area; ACA, anterior cingulate area; LA, lateral amygdalar nucleus; BLA, basolateral amygdalar nucleus; BMA, basomedial amygdalar nucleus; PA, posterior amygdalar nucleus; CEA, central amygdalar nucleus; IA, intercalated amygdalar nucleus.
