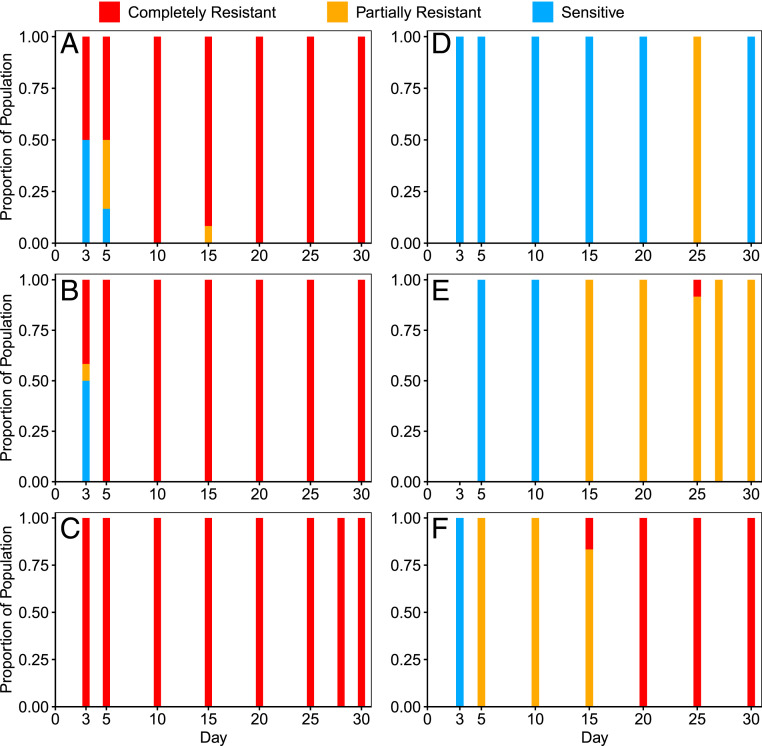
Fig. 2.
Proportion of sensitive (blue), partial (yellow), and complete (red) resistance of bacterial populations at various days of the coevolution experiment to ancestral phages from respective treatments (n = 12 isolates per timepoint). λunt Populations 1 to 3 correspond to A–C and λtrn Populations 1 to 3 correspond to D–F, respectively.

