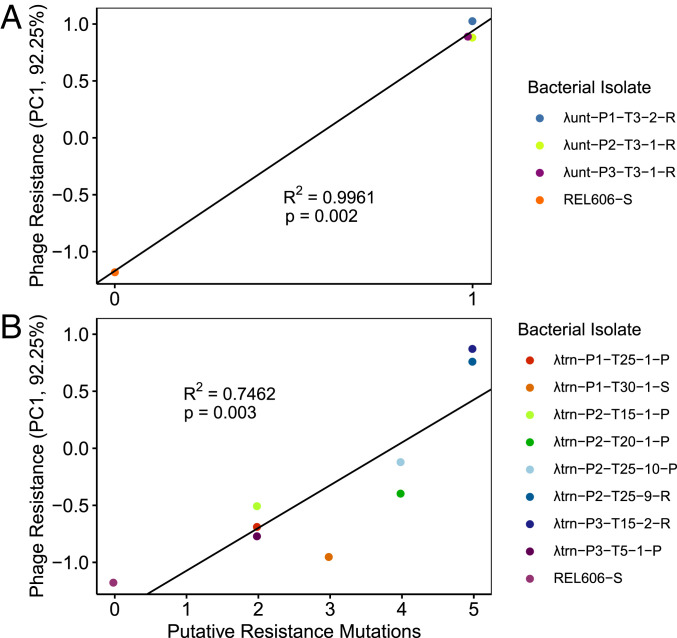
Fig. 3.
Relationship between the number of putative resistance mutations and the level of phage resistance (PC1 is indicative of resistance; SI Appendix, Fig. S4) from coevolutionary treatments with λunt (A) and λtrn (B). Linear regressions (PC1 ∼Putative Resistance Mutations, black lines) are significant for both Panels A and B; however, the number of mutations required for high levels of resistance is greater in B. The bacterial strains are labeled as [Treatment] − [Population] − [Day Isolated] − [Isolate #] − [Resistance Status], in which S = Sensitive, R = Complete Resistance, and P = Partial Resistance to phages from respective treatments.

