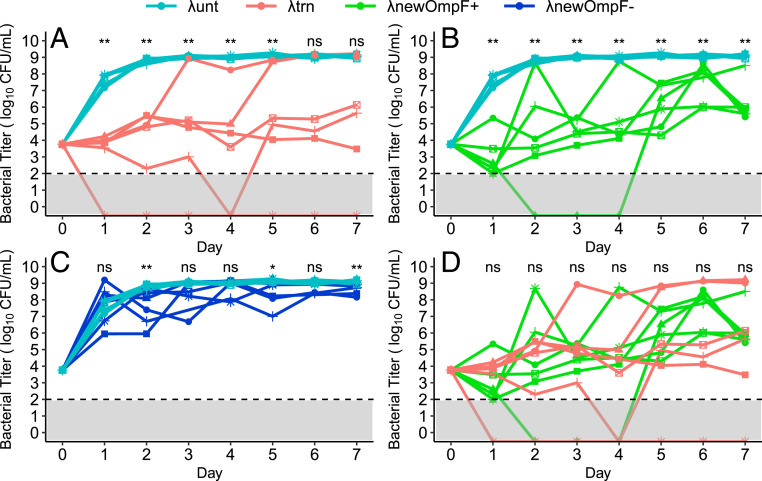
Fig. 7.
Bacterial densities during 7 d of coculture with different phage genotypes. The data are repeated in different panels to aid visualization of paired comparisons: (A) λunt and λtrn, (B) λunt and λnewOmpF+, (C) λunt and λnewOmpF-, and (D) λtrn and λnewOmpF+. For λunt and λtrn, lines and symbols represent replicates (n = 6, each). For λnewOmpF+ and λnewOmpF−, the lines and symbols represent different genotypes (n = 6 genotypes, 1 replicate each, see SI Appendix, Fig. S9). The dashed line and gray shading denote limit of detection. The significant differences are indicated above days calculated via a Mann–Whitney U test (not significant [ns] P > 0.05, *P = 0.041, **P ≤ 0.005).

