Fig. 1.
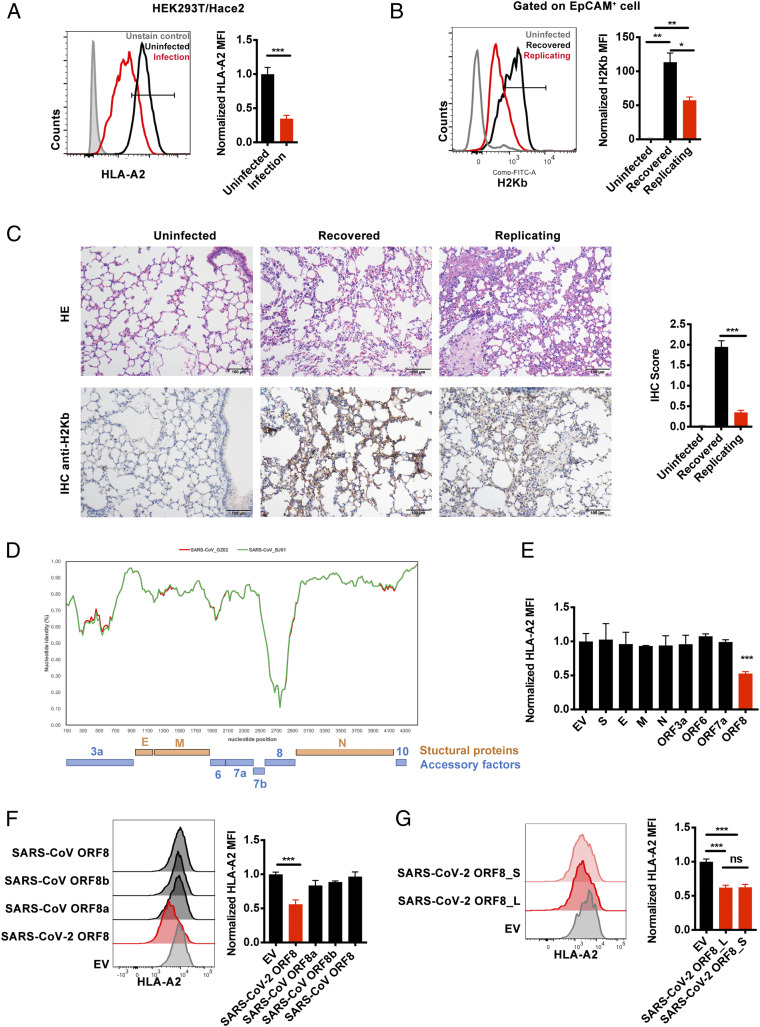
SARS-CoV-2 infection leads to MHC-Ι down-regulation through ORF8. (A) The ACE2-expressing HEK293T cells (HEK293T/Hace2) were infected with SARS-CoV-2 (hCoV-19/CHN/SYSU-IHV/2020) (MOI = 1). At 48 h after infection, cells were collected for flow cytometry analysis (n = 6). Mean fluorescence intensity (MFI) was normalized to uninfected group. (B) hACE2 mice were intranasally infected with 4 × 10³ PFU (recovered), 4 × 10⁴ PFU (replicating) SARS-CoV-2 virus, or uninfected as control. At day 6 after infection, total suspended cells of the lung tissue were collected for flow cytometry analysis. MFI of H2Kb+ cells (gated on EpCAM+ cells) were shown (n = 3). MFI was normalized to uninfected group. (C) Hematoxylin and eosin staining and immunohistochemistry against H2Kb were evaluated in lungs of infected mice in B. (D) Similarity plot based on the genome sequence of SARS-CoV-2_WHU01 (accession no. MN988668) and the genome sequences of SARS-CoV_BJ01 (AY278488) and SARS-CoV_GZ02 (AY390556) were used as reference sequences. The nucleotide position started from the orf3a gene of SARS-CoV-2. (E–G) The effect of different viral proteins on the expression of HLA-A2. The viral protein–expressing plasmids were transfected into HEK293T cell line, and cells were collected at 48 h after transfection for flow cytometry analysis to analyze the MFI of HLA-A2+ cells (n = 5) normalized to empty vector (EV) group. The plasmids expressing SARS-CoV-2 structural proteins and ORFs (E), SARS-CoV ORF8, ORF8b and ORF8a (F), and L and S subtype of SARS-CoV-2 ORF8 or EV (G) were used. The data were shown as mean ± SD (error bars). Student’s t test and one-way ANOVA was used. P < 0.05 indicates a statistically significance difference; *P < 0.05; **P < 0.01; ***P < 0.001.

