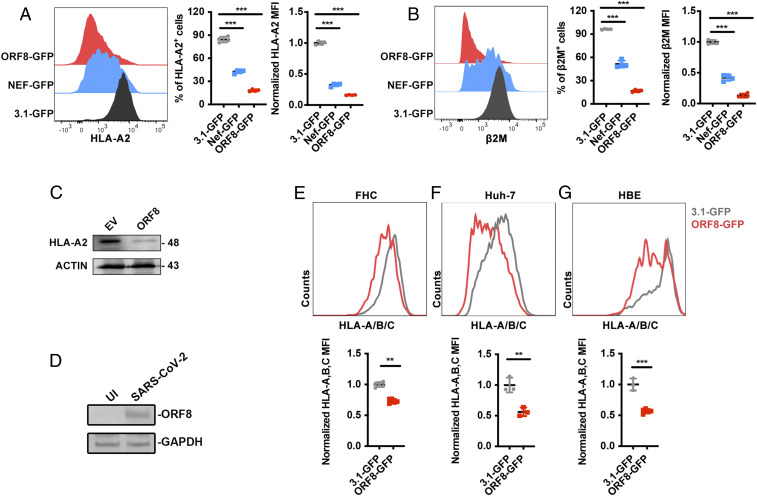
Fig. 2.
ORF8-induced MHC-Ι down-regulation. (A and B) 3.1-GFP (negative control), ORF8-GFP, or HIV-Nef-GFP (positive control)–expressing plasmid was transfected into HEK293T cells, respectively. Cells were collected at 48 h after transfection for flow cytometry analysis. Frequency and mean fluorescence intensity (MFI) of HLA-A2+ and β2-microglobulin (β2M)+ cells (gated on GFP+ cells) were shown (n = 5). MFI was normalized to GFP group. (C) Western blot analysis for A (n = 3). (D) HEK293T/Hace2 cells were infected with SARS-CoV-2 (hCoV-19/CHN/SYSU-IHV/2020) (MOI = 0.1). At 48 h after infection, cells were collected for Western blot (n = 3). (E–G) GFP- (negative control) or ORF8-GFP–expressing plasmids were transfected into FHC, HBE, or Huh7 cells, respectively. At 48 h after transfection, cells were harvested for flow cytometry analysis (gated on GFP+ cells) (n = 3) and normalized to GFP group. The data were shown as mean ± SD (error bars). Student’s t test and one-way ANOVA was used. P < 0.05 indicates statistically significant difference; **P < 0.01; ***P < 0.001.

