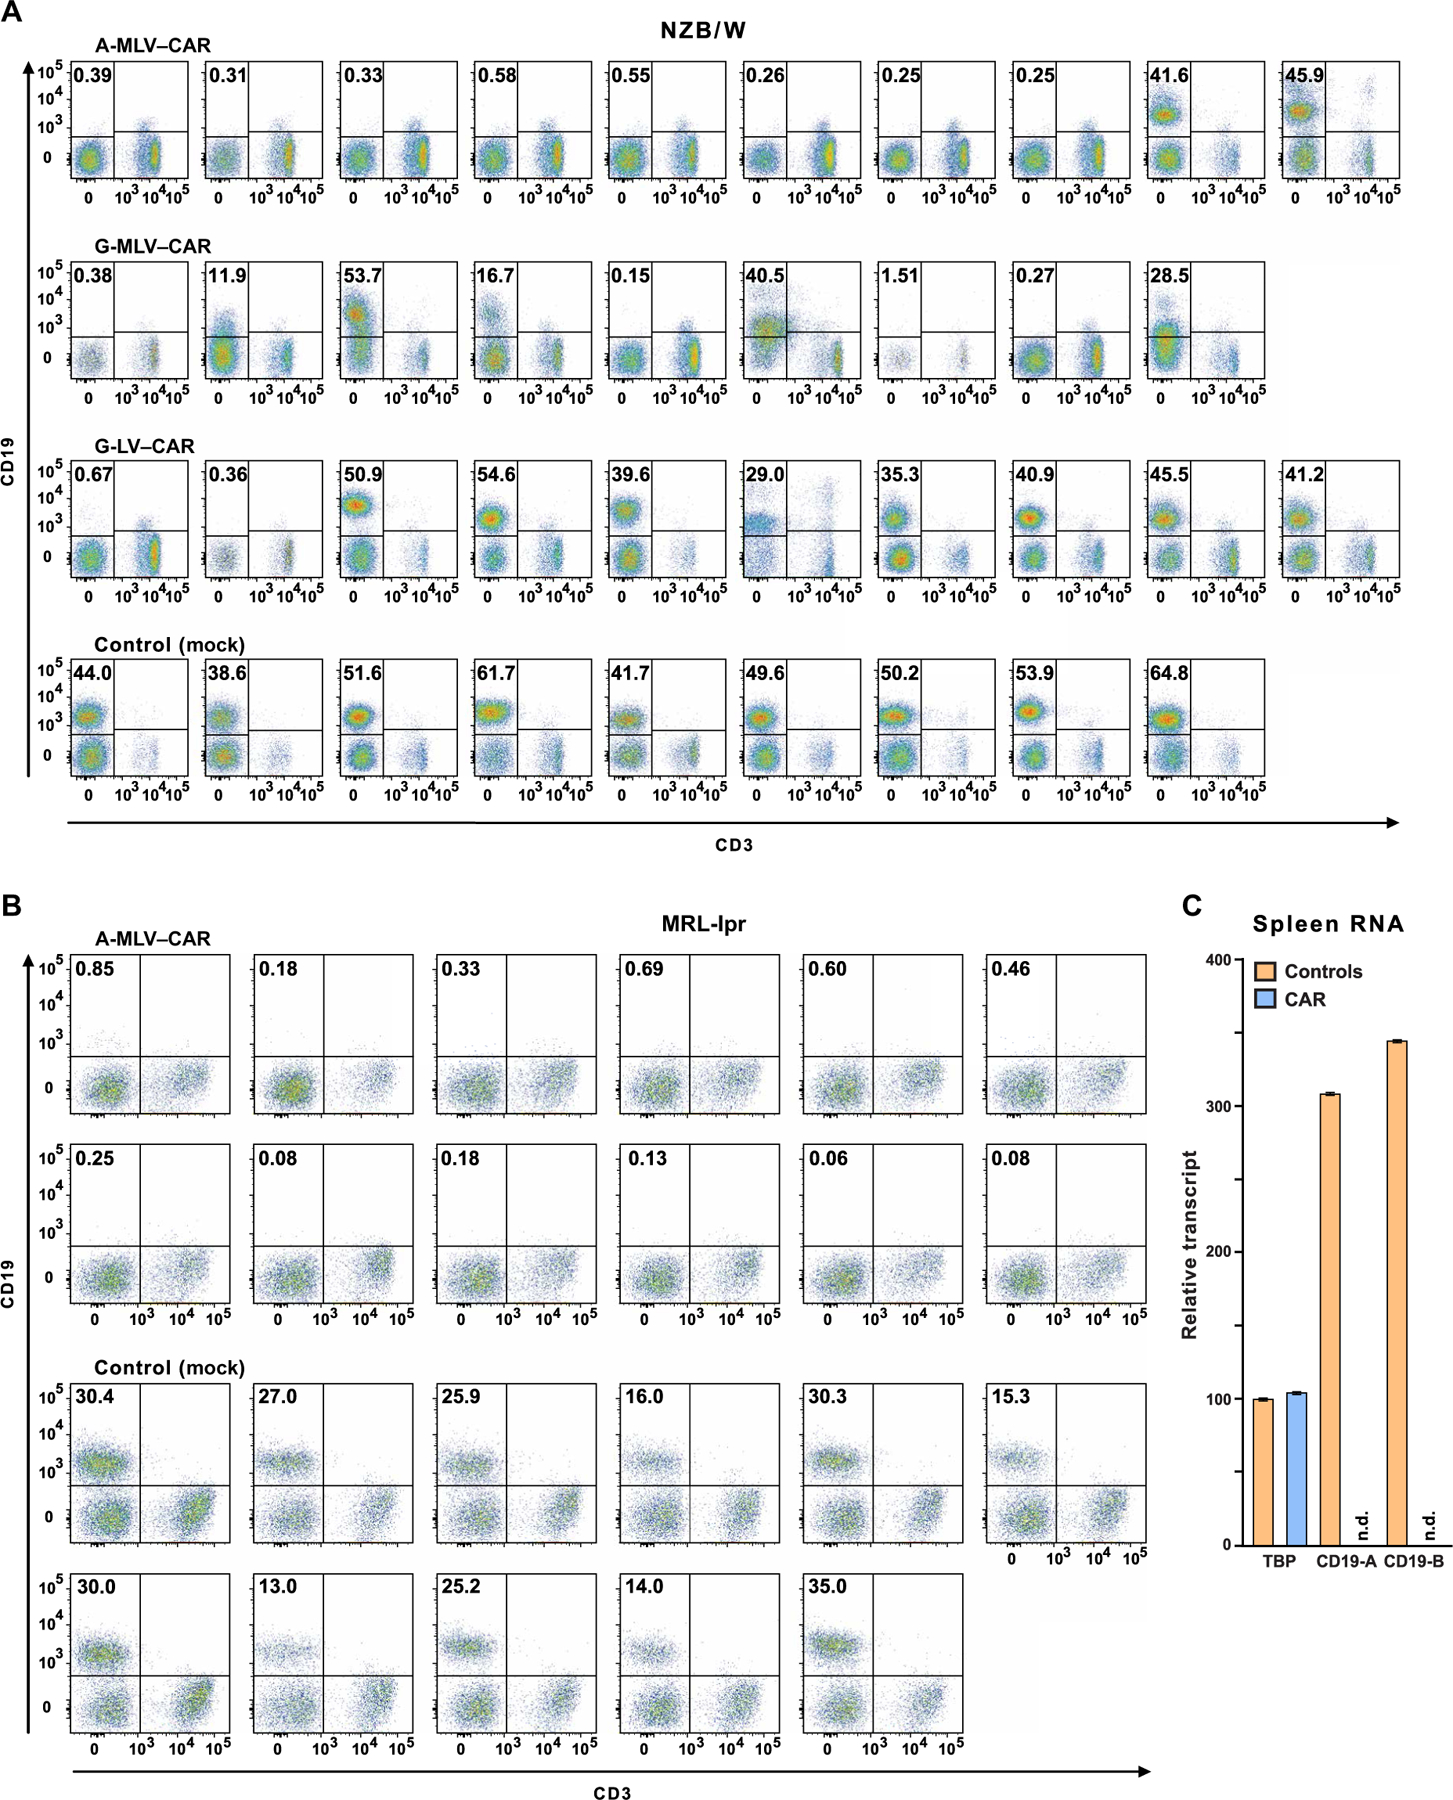
Fig. 2. Flow cytometry of blood lymphocytes from CAR T cell–treated mice and controls.

Mice were administered CD19-targeted CAR CD8+ T cells transduced by one of three different viruses, as indicated above the plots. CD19+ B cell depletion was assessed 2 months after treatment. Pseudocolor plots indicate CD19 and CD3 expression on lymphocytes, as defined by forward and side scatter in blood from individual mice. Frequencies of CD19+ B cells are shown in the top left quadrant. (A) Fourteen NZB/W mice in the three transduction groups that had less than 1% CD19+ lymphocytes were designated as CD19-d, whereas control mice and 15 of the CAR T cell–treated mice that had 12 to 60% CD19+ B cells were combined into the CD19-sufficient (CD19-s) experimental group. (B) MRL-lpr mice were injected with A-MLV–CAR–transduced CD8+ T cells or with nontransduced CD8+ T cells (control), and frequencies of CD19+ lymphocytes were determined. (C) Total RNA from the spleens of four control and four CAR T cell–treated mice was purified to measure transcripts coding for CD19 and TATA binding protein (TBP). CD19 message, as measured by reverse transcription polymerase chain reaction (RT-PCR) at two exon-intron boundaries (CD19-A or CD19-B; see table S2 for details), was determined in CAR T cell–treated mice and controls. n.d., nondetectable.
